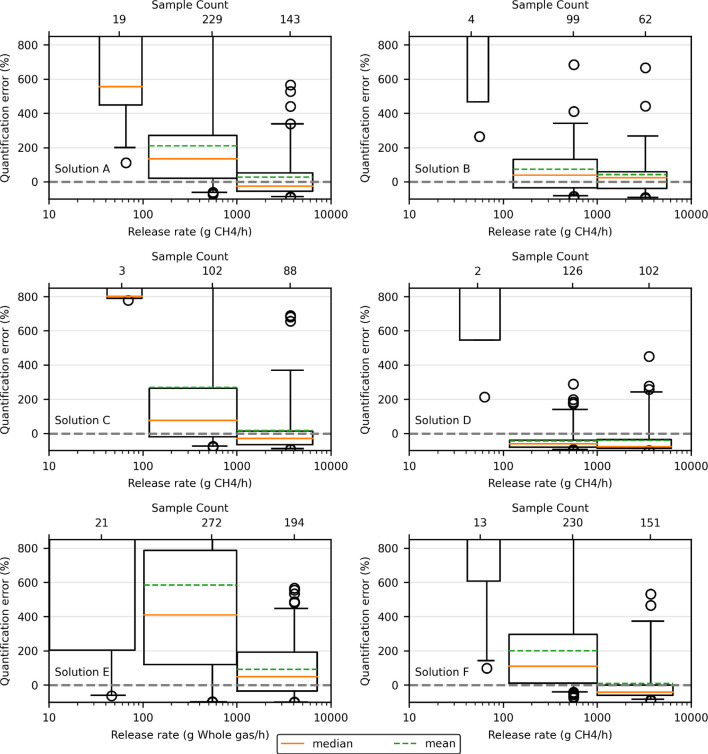
Figure 4.
Box plots summarizing the quantification error (%) of emission estimates for all the solutions that reported quantification estimates. Boxes summarize data in each order of magnitude. Difference between mean and median indicate skewness in the data set. The box represents the inner quartile range, whiskers include 95% of the data, and open-circle markers represent outliers. The width of each box represents the minimum to maximum controlled release rate included in each range. The y-axis limit of each panel has been restricted to −100% to 850%, i.e. −1× to +8.5×. The sample count is shown above each box. Solution E reported whole gas emissions. Other solutions reported methane.

