. 2023 Feb 15;3(4):695–707. doi: 10.1039/d2ea00129b

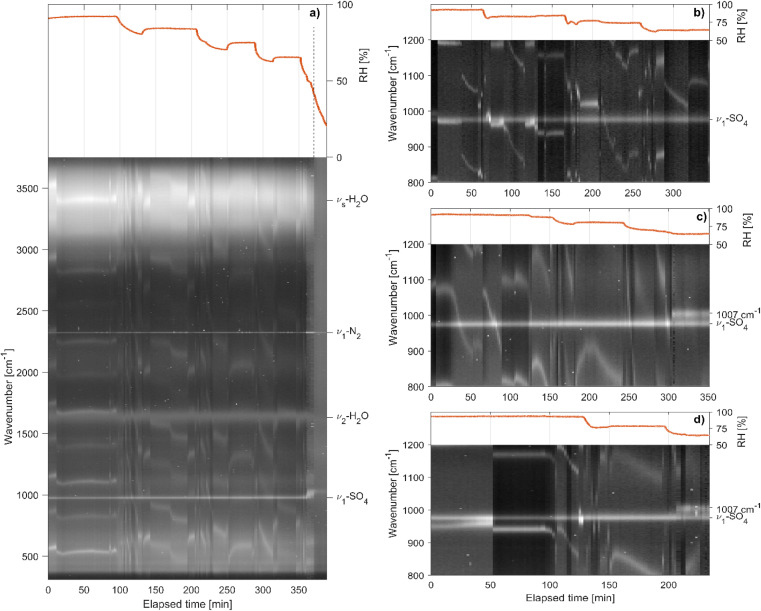
Fig. 7. Time evolution of the Raman spectrum of drying sea salt droplets. (a) Evolution of the whole spectrum for a particle of composition SW 1. The peaks in the Raman spectra are visible as white lines on the dark background. Shifting lines indicate morphology dependent resonances, or whispering gallery modes, shifting with the size of the particle upon changes of the RH (indicated at the top by the red solid line). The molecular Raman peaks are visible as horizontal lines, which do not change position upon changing the RH. The S–O symmetric stretching (ν1-SO4), H–O bending (ν2-H2O) and symmetric O–H stretching (νs-H2O, 2700–3750 cm−1) modes are indicated as well as the stretching mode of nitrogen in the gas phase (ν1-N2). At around 380 min, the RH reaches 50% and efflorescence of the particle is observed (dashed vertical line). (b)–(d) Zoomed-in view of the region around ν1-SO4 for three particles with compositions (b) SW 1, (c) SW 2 and (d) SW 1 + CaCl2. In (b) no qualitative change of the ν1-SO4 peak is observed, even as the RH drops to 63%. In (c) and (d), when the RH drops below 68% the ν1-SO4 peak at 976 cm−1 splits into two peaks at 976 cm−1 and 1007 cm−1 indicating a partial crystallization of the particle.

Fig. 7