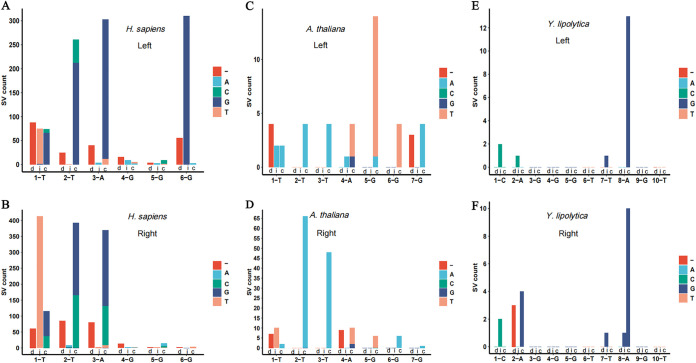
FIG 5.
Statistics of the single-base variation (SV) pattern of both ends of the telomere motif in three species (from left, H. sapiens, A. thaliana, and Y. lipolytica). The x axis represents the site and the corresponding base of the reference telomeric motif sequence. Each site has three bars, as follows: “d,” “i,” and “c,” indicating “deletion,” “insertion,” and “base change,” respectively.

