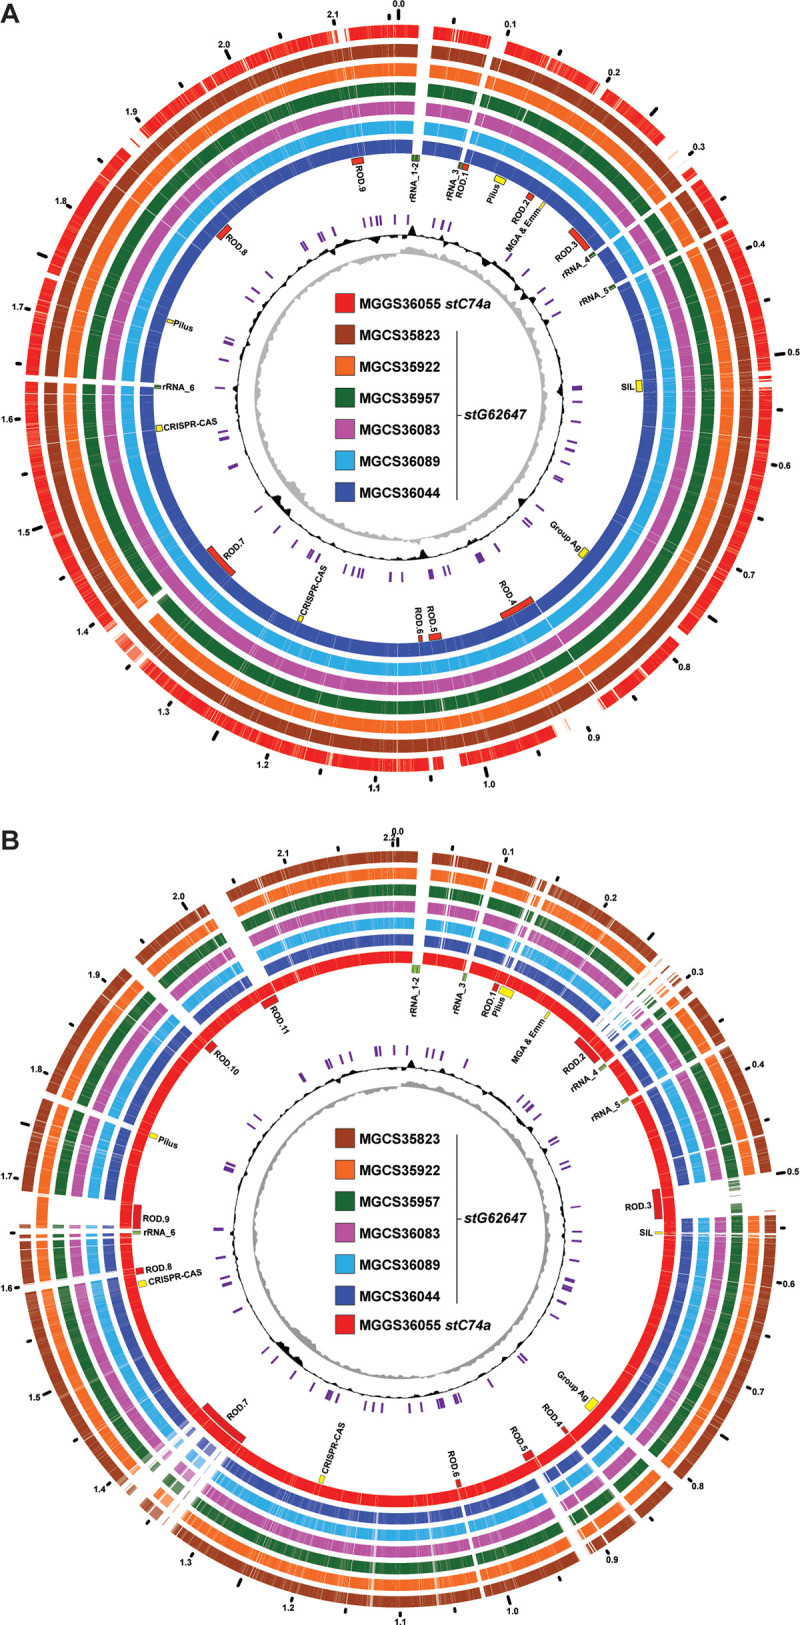
FIG 1.

Comparative genome atlases. (A) Illustrated is the 2,158,391-bp genome of the GCS, ST20, stG62647 strain MGCS36044 and the genetic content it shares with the six other strains of the cohort, as determined by Blastn comparison of CDSs (at 80% identity) relative to the MGCS36044 genome. The common CDS content of the seven strains is shown in the outermost rings, colored as indicated in the central index. The GC skew, indicating the forward and reverse replicores, is plotted in the innermost ring in gray. The G+C percent above and below the genome average (in a sliding window of 10,000 bp) is plotted in the adjacent ring in black. Insertion sequences are shown in purple. Genomic landmarks are indicated as labeled in the ring adjacent to the strain MGCS36044 genome. Of note are nine regions of difference constituting 215.4 kbp, which contain gene content that is largely present in the six stG62647 genomes but is largely absent from the stC74a comparator strain MGGS36055 genome (see Table S3 in the supplemental material). (B) Illustrated is the 2,204,518-bp genome of GGS, ST17, stC74a strain MGGS36055 and the genetic content it shares with the six other strains of the cohort. Of note, there are 11 regions of difference constituting 270.7 kbp which contain gene content present in the stC74a MGGS36055 genome but largely absent in the six stG62647 genomes (Table S4). For both strain MGCS36044 and strain MGGS36055, many of the RODs encode an integrase and have a G+C content that is 3% to 7% lower than that of the genome average (approximately 39.4%), consistent with these regions potentially being integrative mobile genetic elements of exogenous origin.
