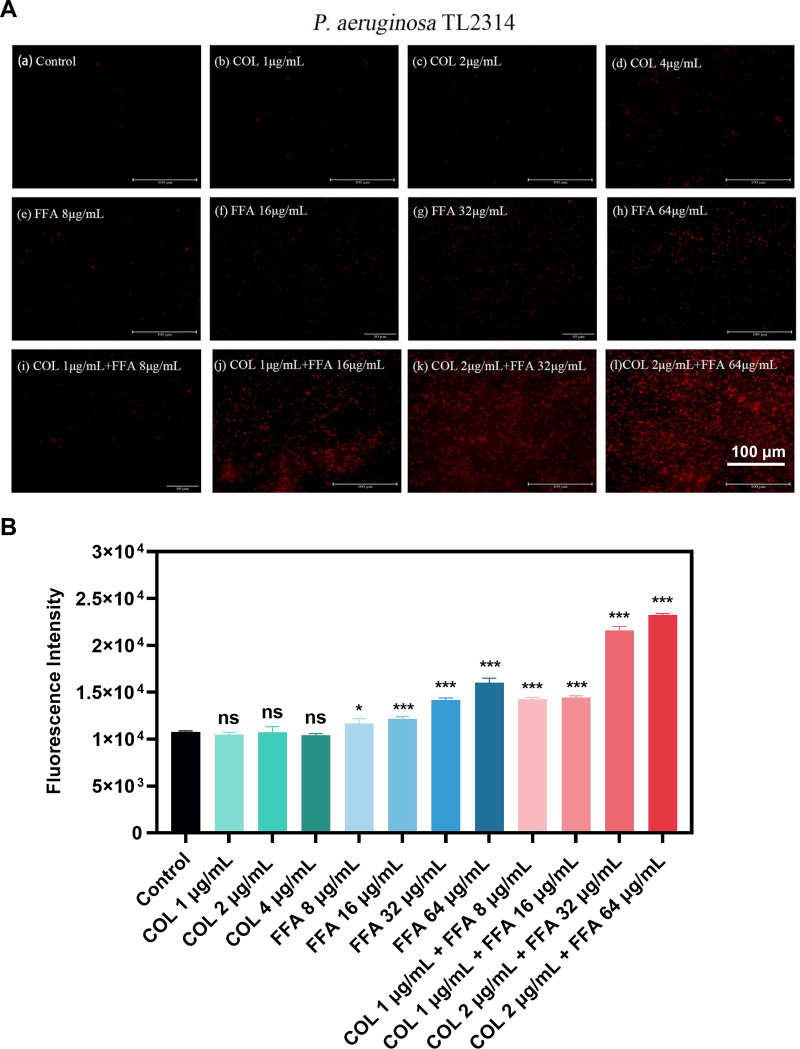
FIG 5.
(A) Fluorescence images of P. aeruginosa TL2314 cells in the exponential phase of growth treated with colistin and/or FFA followed by incubation for 30 min with PI (50 μg/mL PI) before imaging. (B) Fluorescence intensity values for P. aeruginosa TL2314 cells in the exponential phase of growth treated with colistin and/or FFA followed by incubation for 30 min with PI (50 μg/mL PI). ns, not significant; *, P < 0.05; ***, P < 0.001 (by Student’s t tests). Data are means ± SD from triplicate analyses.

