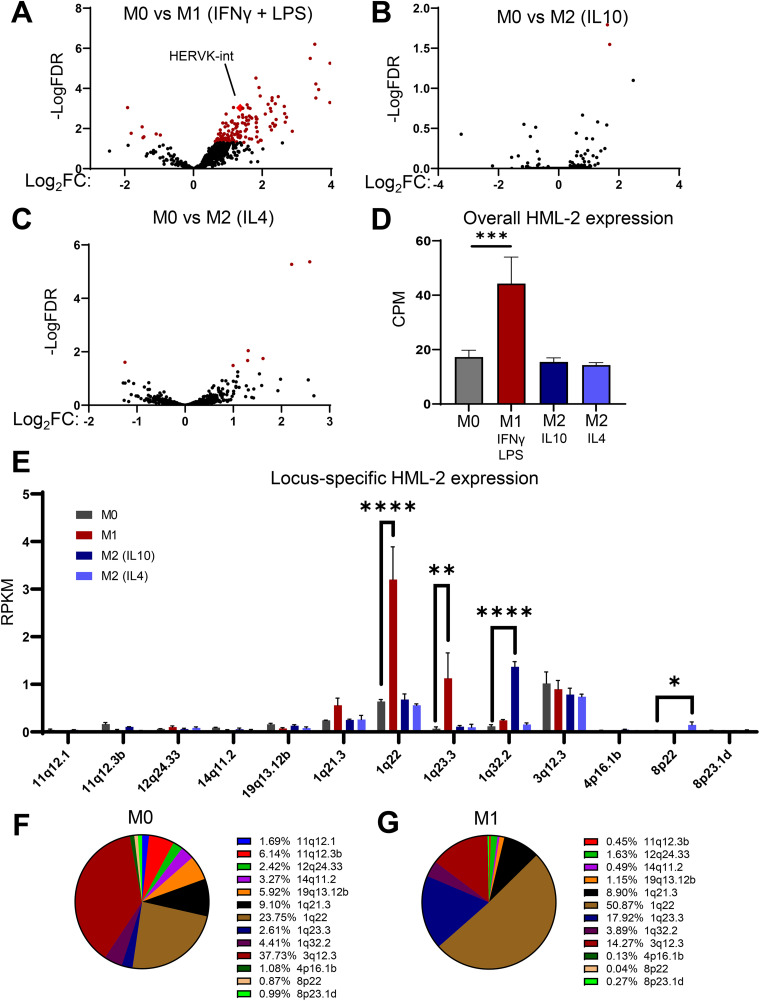
FIG 1.
Pro-inflammatory (M1) polarization of macrophages correlates with retroelement expression. (A to C) Volcano plots showing fold change in retroelement expression measured by TEcount at the subgroup level: M1 polarized, lipopolysaccharide (LPS) + interferon gamma (IFN-γ) (A); M2 polarized, interleukin (IL)-10 (B) and IL-4 (C); versus neutral (M0) monocyte-derived macrophages (MDMs) following 24 h of polarization. Red dots indicate retroelements significantly changed in expression. (D) Expression on RNA level of the HML-2 subgroup (copies per million [CPM]) in M0, M1, M2 (IL-10), and M2 (IL-4) MDMs. (E) Locus-specific expression of the HML-2 subgroup measured by Telescope analysis of transcriptomic sequencing (RNA-seq) data set in M0, M1, M2 (IL-10) and M2 (IL-4) polarized MDMs. RPKM, reads per kilobase per million reads mapped. (F and G) Proportion that each HML-2 provirus constitutes in the total amount of HML-2-derived transcripts in M0 (F) and M1-polarized (G) MDMs, based on analysis shown in panel E. Data are presented as means ± standard error of the mean (SEM) from three donors as biological replicates. ****, P < 0.0001; ***, P < 0.001; **, P < 0.01; *, P < 0.05 according to edgeR analysis for panels D and E. Due to the nature of the analysis, only significantly positive fold changes are highlighted in panel E; all fold changes can be found in Table S1. CPM was used for overall HML-2 expression in panel D due to differences in HML-2 proviral length on the locus-specific level.

