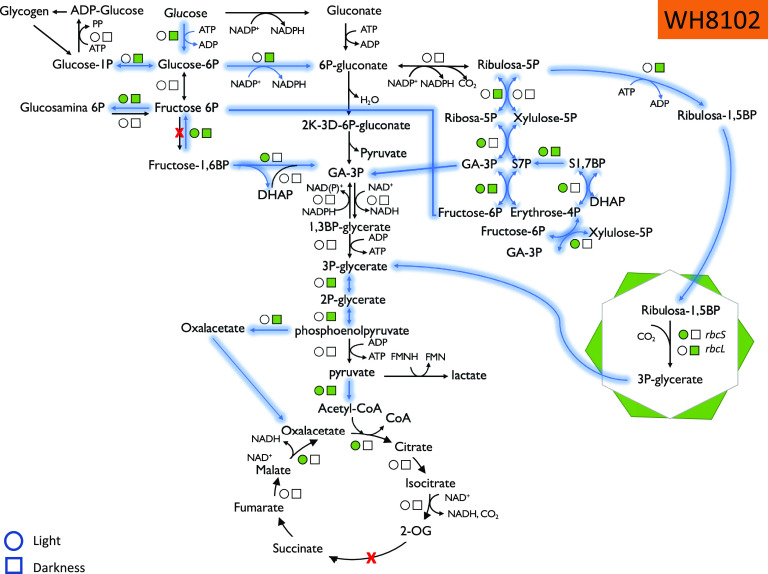
FIG 2.
Summary of the proteomics results, showing the statistically significant changes in enzymes involved in glucose metabolism in Synechococcus sp. strain WH8102 under light and dark conditions. Circles, light; squares, darkness. Green color indicates an increase in abundance. Arrows indicate the metabolic flow upon glucose addition.

