FIG 4.

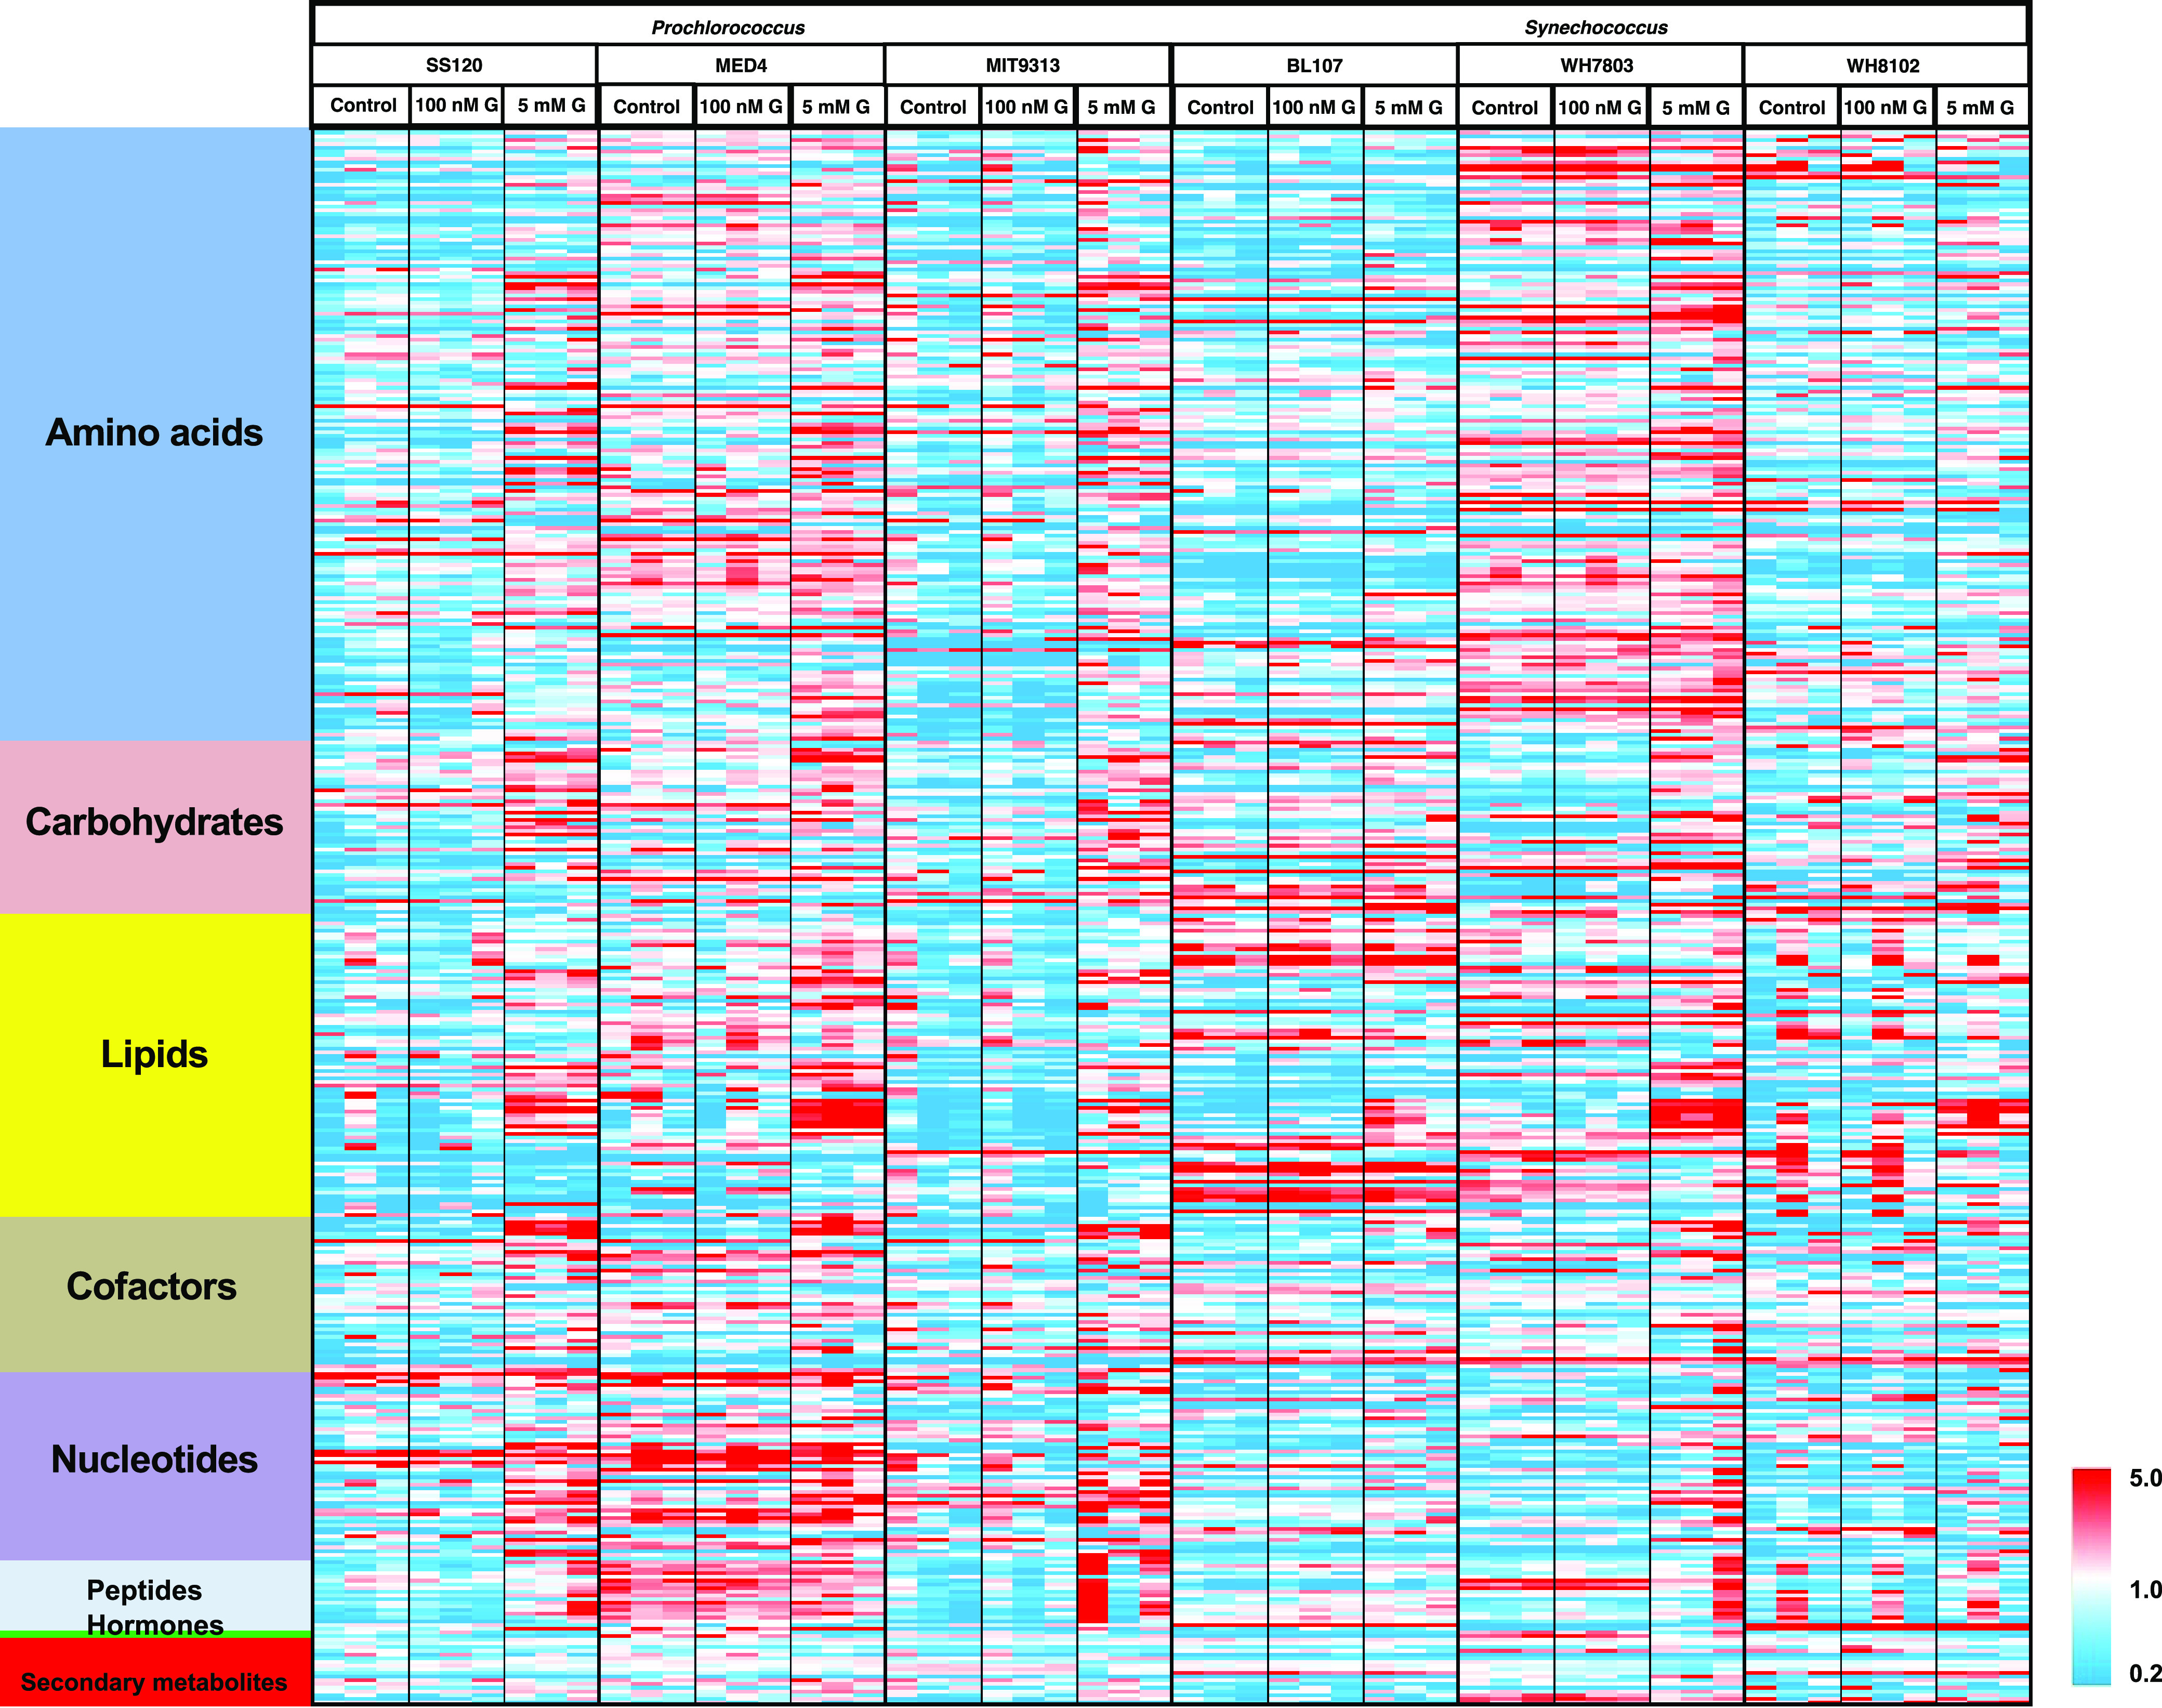
Heatmap showing the main metabolome changes observed in the six studied picocyanobacterial strains. Red color indicates an increase in abundance, and blue color indicates a decrease in abundance, following the scale shown at the bottom right.

Heatmap showing the main metabolome changes observed in the six studied picocyanobacterial strains. Red color indicates an increase in abundance, and blue color indicates a decrease in abundance, following the scale shown at the bottom right.