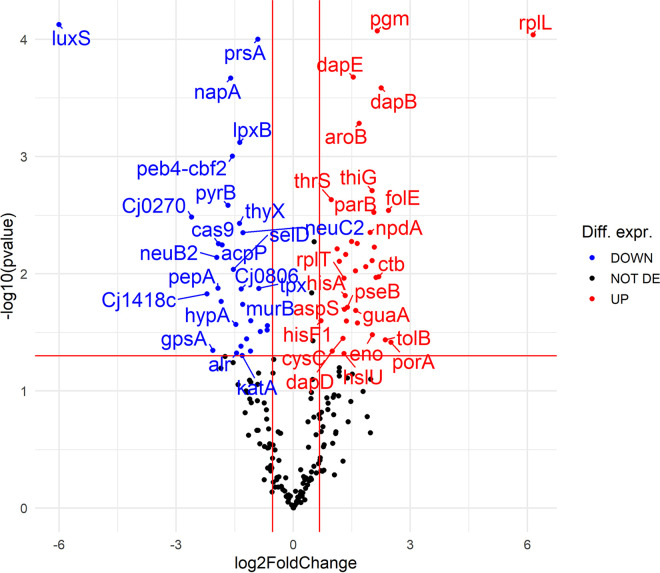
FIG 8.
Volcano plot showing proteomic data for C. jejuni 11168ΔluxS (luxS mutant) compared to wild type. Red dots show proteins with significant fold change in the luxS mutant proteome (FDR, P ≤ 0.05). A left shift indicates downregulation (21 proteins), and a right shift indicates upregulation (32 proteins). The further the dot is from the center, the stronger its differential expression.

