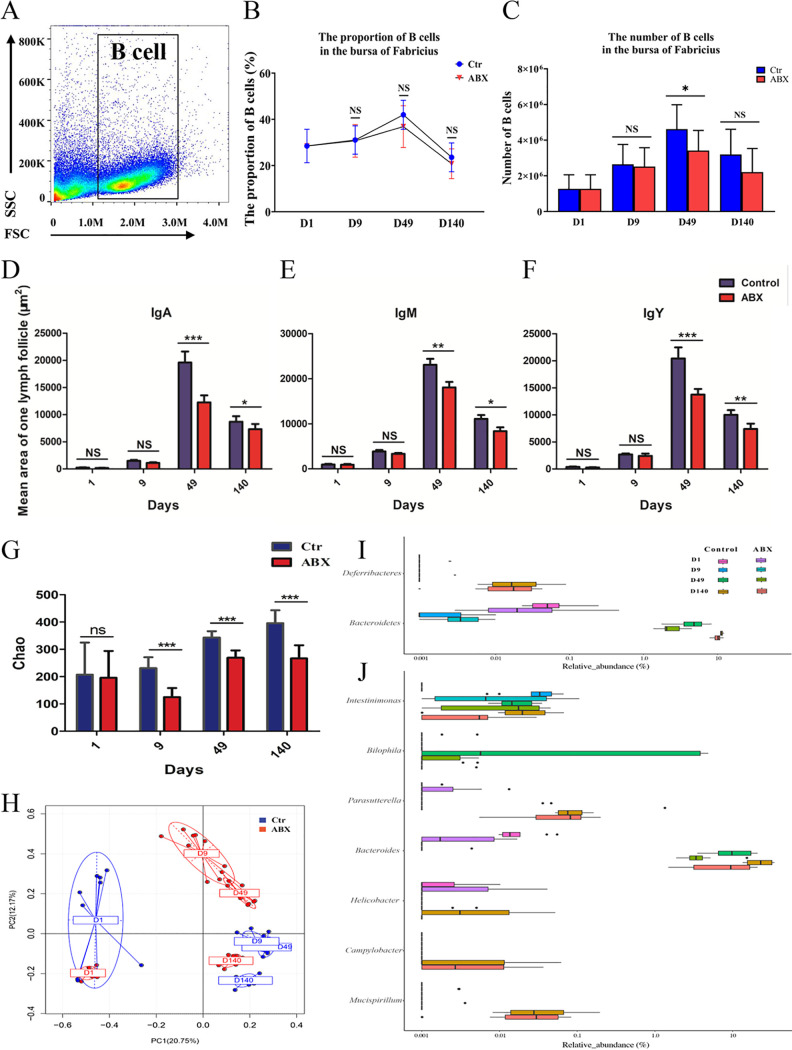
FIG 3.
Changes in Bu-1α, IgA, IgM, and IgY expression in the bursa of Fabricius and the gut microbiota with antibiotic treatment. (A) Single cells produced from the bursa were stained with an anti-Bu-1 antibody. FSC, forward scatter; SSC, side scatter. (B) The percentage of bursal B cells was examined by flow cytometry on days 1, 9, 49, and 140. (C) The number of bursal B cells was examined by flow cytometry on days 1, 9, 49, and 140. (D) The area occupied by IgA+ B lymphocytes in one lymphoid follicle. (E) The area occupied by IgM+ B lymphocytes in one lymphoid follicle. (F) The area occupied by IgY+ B lymphocytes in one lymphoid follicle. *, P < 0.05; **, P < 0.01; *** P < 0.001 (n = 10). (G) Alpha diversity scores based on the Chao1 index. (H) Principal-coordinate analysis of cecal microbial beta diversity based on Bray-Curtis dissimilarity for each age group. (I and J) Changes in the gut microbiota at the phylum and genus levels on days 1, 9, 49, and 140. Each data point is the mean with the SEM. ***, P < 0.001 (n = 10).

