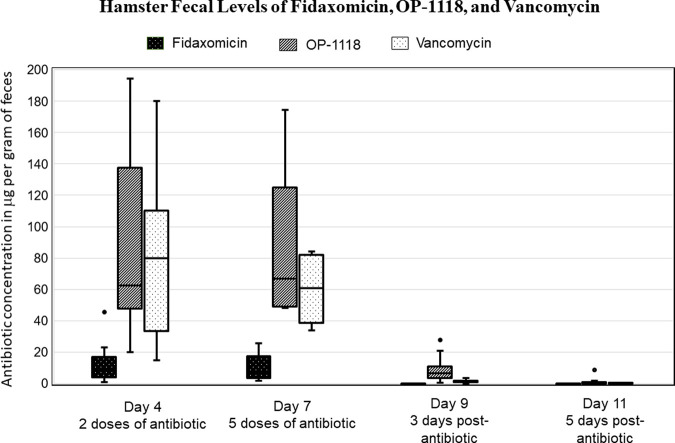
FIG 2.
Fecal antibiotic levels during treatment on experimental days 4 and 7 (collected 24 h after the last treatment dose on day 6) and after treatment on days 9 and 11. Levels in μg/gm feces are presented in a box-and-whisker plot with the median (horizontal line), interquartile range (box), and the lower/upper fences (whiskers).

