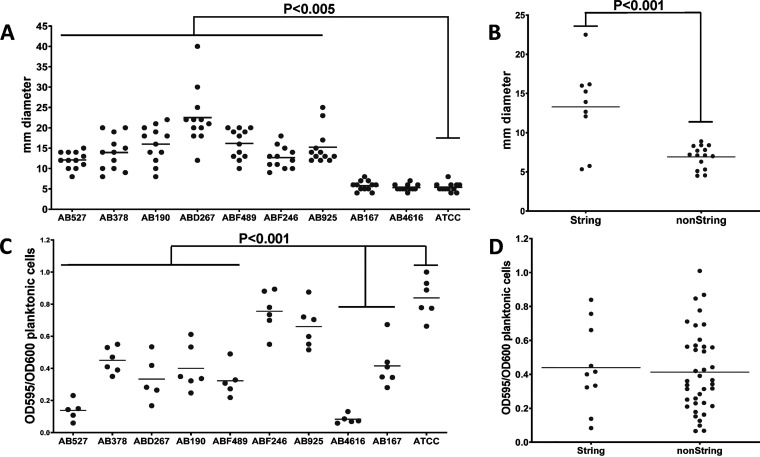
FIG 3.
Phenotypic description of the study isolates. (A) Motility of string-positive isolates on Difco semisolid agar. Motility was calculated as the diameter of colony spread. ATCC 19606 was used as the control strain. Each dot represents the average measurement from a different plate. Medians are indicated by the lines. The P value was calculated using Student’s t test. (B) Motility of string-positive isolates analyzed in comparison to 12 randomly chosen clinical non-string-positive isolates. (C) Determination of the biofilm biomass formed by string-positive isolates and ATCC 19606 using a microtiter static biofilm model. The biofilm biomass was quantified following 18 ± 2 h of incubation at 37°C. Each isolate was tested in 6 replicates in 3 different experiments. Statistically significant decreases in biomass between the ATCC 19606 control strain and isolates AB527, AB378, ABD267, AB190, ABF49, AB4616, and AB167 are indicated. Medians are indicated by the lines. The P value was calculated using Student’s t test. (D) Biofilm biomass of string-positive isolates compared to the biofilm biomass of 12 randomly chosen clinical non-string-positive strains. Medians are indicated by the lines.

