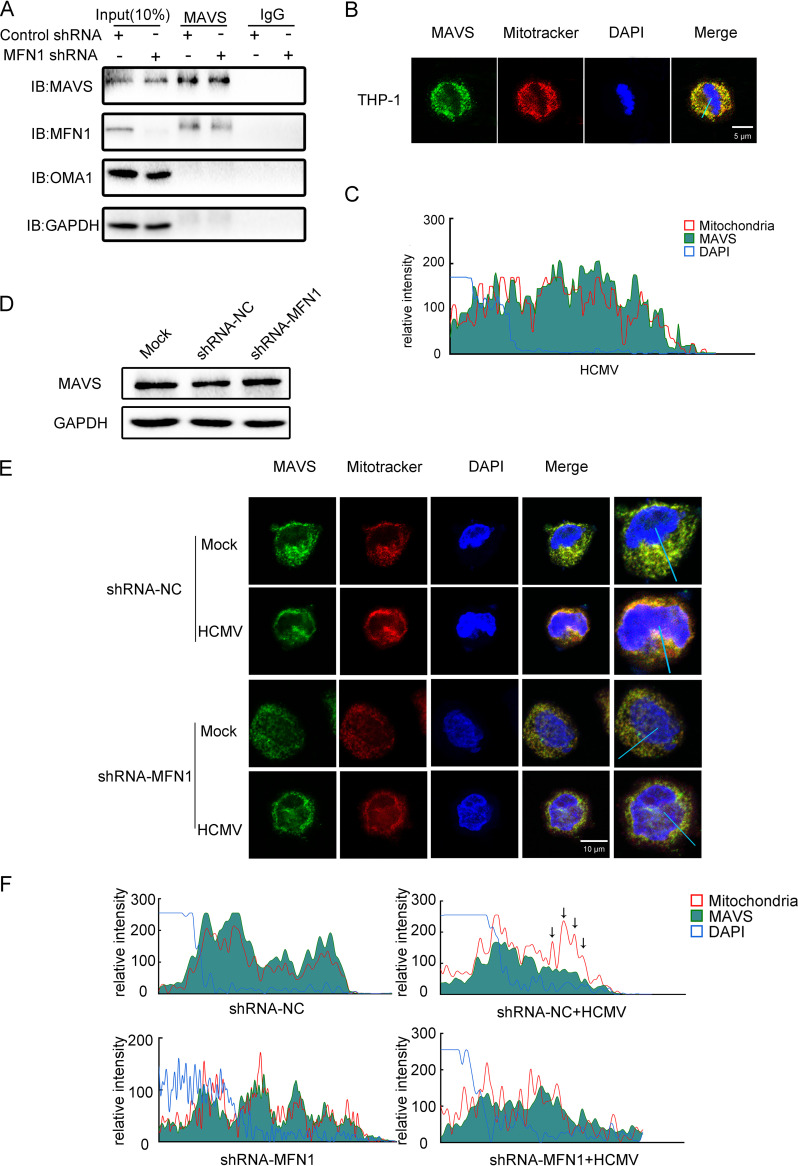
FIG 3.
MFN1 altered the distribution of MAVS and promoted IFN1 production. (A) Coimmunoprecipitation analysis of MAVS and MFN1 in lysates from control shRNA-treated and MFN1-knockdown THP-1 cells. (B) THP-1 cells were stained with MitoTracker (mitochondria) and anti-MAVS antibody. The nuclei were visualized by staining with DAPI throughout this study. (C) The fluorescent image was quantified in the area indicated by blue line (right). (D) Western blot of MAVS in lysates from MFN1-knockdown THP-1 cells infected with HCMV (MOI = 5) for 48 h. GAPDH was used as a loading control. (E) The control shRNA-treated and MFN1-knockdown THP-1 cells were infected with HCMV (MOI = 5) for 48 h and stained with MitoTracker (mitochondria), anti-MAVS, and DAPI throughout this study. (F) The fluorescent image was quantified in the area indicated by blue line (right). IB, immunoblot.

