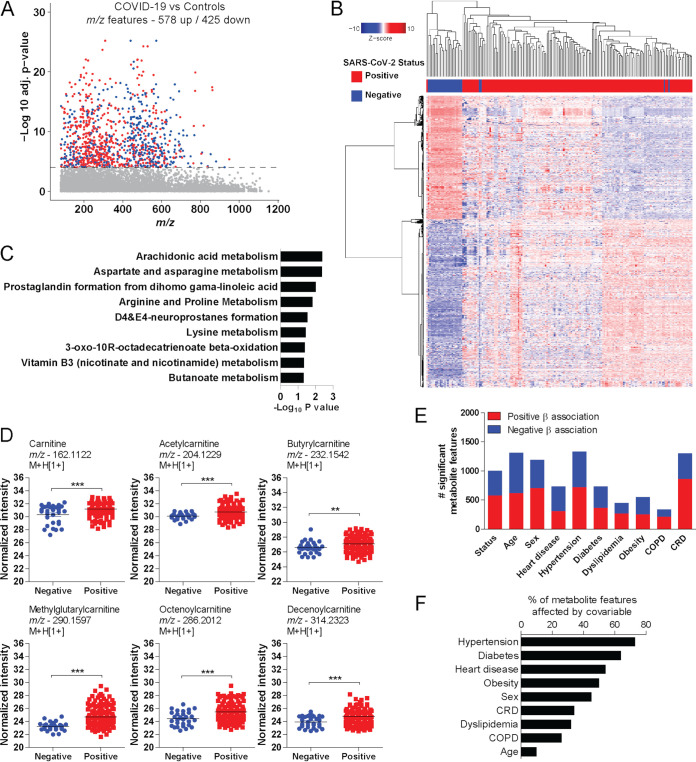
FIG 1.
Plasma metabolomic signatures of SARS-CoV-2 infection. (A) Manhattan plot depicting significant metabolite features in plasma of individuals with COVID-19 compared to control donors. The dashed line indicates an FDR-adjusted P value of <0.0001. Upregulated features are in red and downregulated features in blue. (B) Two-way hierarchical clustering based on significant metabolite features. (C) Mummichog pathway analysis of significant features. (D) Differential abundance of carnitine and acylcarnitines according to infection status. (E) Number of significant metabolite features associated with SARS-CoV-2 infection, or age, sex, COPD, CRD, diabetes, dyslipidemia, heart disease, hypertension, and obesity. (F) Percentage of metabolite features whose coefficient of association with infection changes by more than 10% with the inclusion of the covariable in the logistic regression model. Tukey’s multiple-comparison test was used in additional statistics. **, P < 0.01; ***, P < 0.001.

