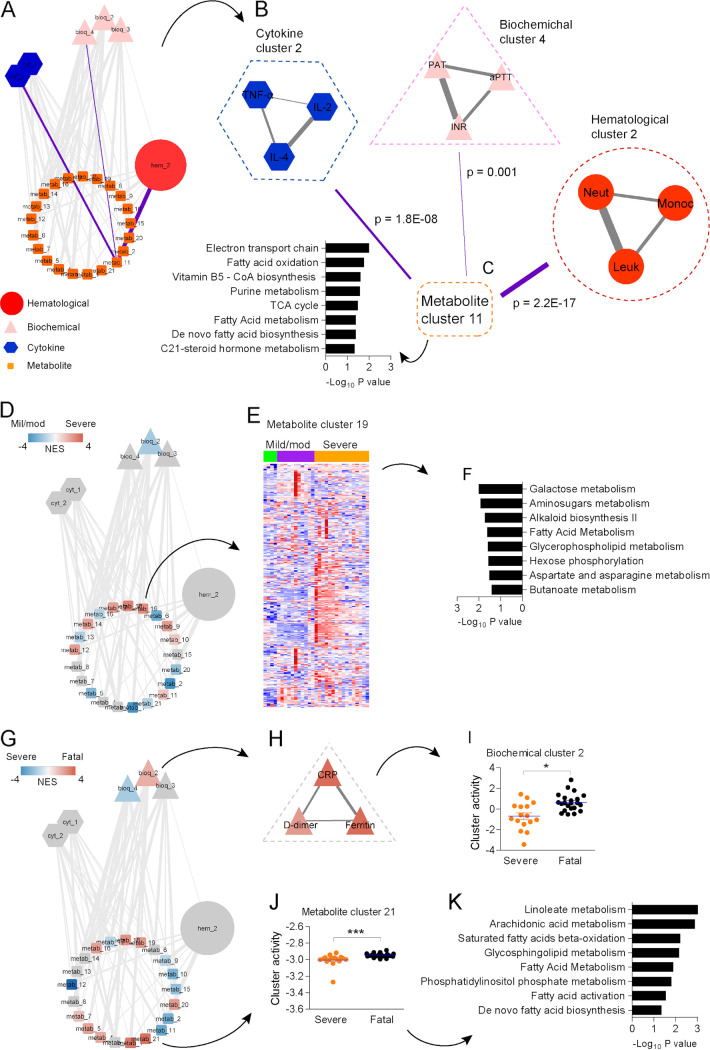
FIG 4.
Integrative hierarchical community network underlying COVID-19. (A) The main network is composed of subnetworks (communities) of hematological data (hematological cluster), laboratory data (biochemical clusters), cytokine data (cytokine clusters) and metabolomics data (metabolite clusters), which are represented by nodes. Significant associations obtained via PLS regression and permutation test are represented by edges between nodes. (B) Amplified visualization of nodes linked by purple highlighted edges on the main network. (C) The most significant association in the network between metabolite cluster 11 and hematological cluster 2. (D) Communities related to the severity of COVID-19, colored by normalized enrichment score (NES) in a comparison between individuals with mild/moderate and severe COVID-19. Red indicates higher association with severe disease. (E) Heat map depicting the abundance of metabolite features composing metabolite cluster 19 in individuals with mild/moderate and severe disease. (F) Mummichog pathway analysis of metabolite cluster 19. (G) Communities related to fatality of COVID-19, colored by NES in a comparison between individuals with severe and fatal disease. Red indicates a higher association with death. (H) Amplified visualization of biochemical cluster 2. (I) Differential cluster activity of biochemical cluster 2 between individuals with severe and fatal disease. (J) Differential cluster activity of metabolite cluster 21 between individuals with severe disease and fatal disease. (K) Mummichog pathway analysis of metabolite cluster 21. *, P < 0.05; ***, P < 0.001.

