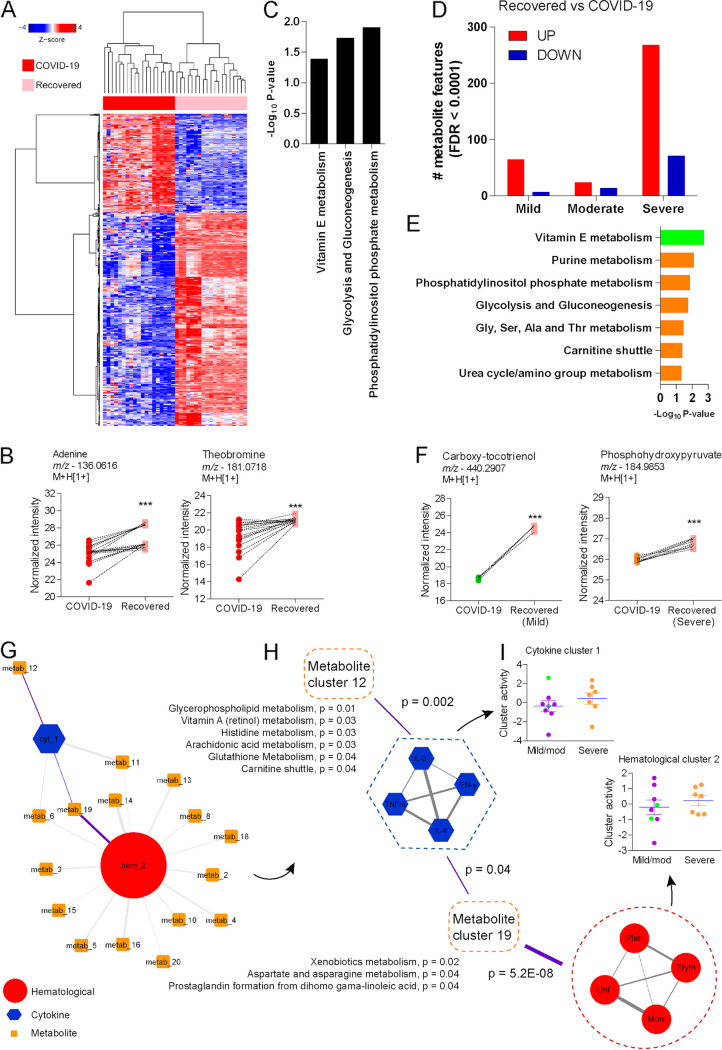
FIG 5.
Metabolomic signatures of recovery from acute COVID-19. (A) Two-way hierarchical clustering of significant metabolite features on a longitudinal follow-up of selected individuals with COVID-19. (B) Differential abundance of adenine and theobromine before and after recovery from COVID-19. (C) Mummichog pathway analysis of significant metabolite features. (D) Significant metabolite features before and after recovery from acute COVID-19, stratified by disease severity. (E) Mummichog pathway analysis of significant metabolite features stratified by disease severity. (F) Differential abundance of metabolite features annotated as carboxy-tocotrienol and phosphohydroxypyruvate before and after recovery from acute COVID-19, stratified by disease severity. (G) Integrative hierarchical community network underlying recovery of acute COVID-19. (H) Amplified visualization of nodes linked by purple-highlighted edges on the main network. (I) Cluster activity of cytokine cluster 1 and hematological cluster 2 between patients with mild/moderate and severe disease who recovered from acute COVID-19. ***, P < 0.001.

