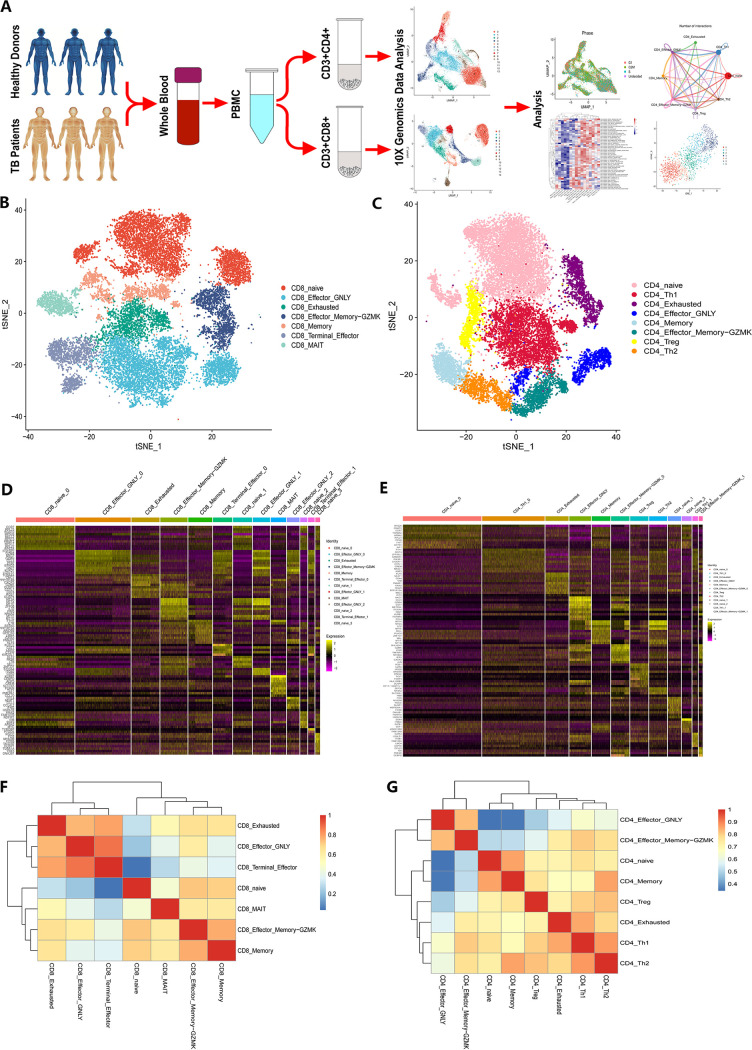
FIG 1.
Single-cell transcriptomic clustering of CD4+ and CD8+ T cells from patients with active TB and healthy donor individuals. (A) Schematic workflow design for scRNA-seq. CD4+ and CD8+ T cells were purified from PBMCs collected from three patients with active TB and three healthy donors. A 10× genomic scRNA-seq platform was used to perform transcriptomic profiling. (B and C) CD8+ (B) and CD4+ (C) T-cell subset population features. The t-SNE projection was used to visualize the nine CD8+ T cell subsets. Each dot represents a single cell colored according to the cell clustering information. (D and E) Heatmaps showing the top marker genes across each CD8+ (D) and CD4+ (E) T-cell cluster. (F and G) Heatmaps showing the pairwise Pearson correlation coefficients of T-cell subsets for CD8+ T cells (F) and CD4+ T cells (G).

