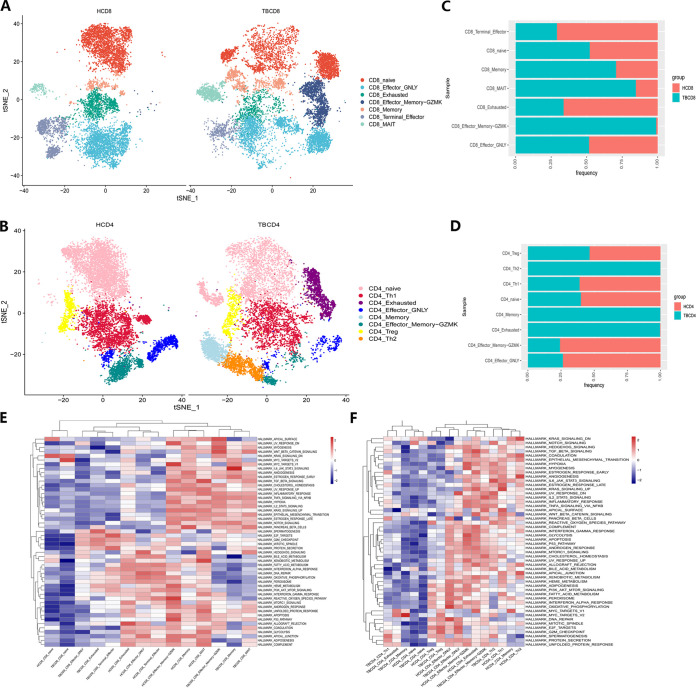
FIG 2.
Heterogenic CD4+ and CD8+ T-cell subset characteristics in patients with active TB. (A and B) T-SNE diagrams of single-cell profiling for each CD8+ (A) and CD4+ (B) T-cell subset across the TB (left) and healthy donor (right) groups. Each dot represents a single cell colored according to the cell-clustering information. (C and D) Stacked bar plots for CD8+ (C) and CD4+ (D) T-cell proportions across the TB (blue) and healthy donor (red) groups. (E and F) Hallmark gene set-based GSVA heatmaps in each CD8+ (E) and CD4+ (F) T-cell subset across tuberculosis and healthy donor groups.

