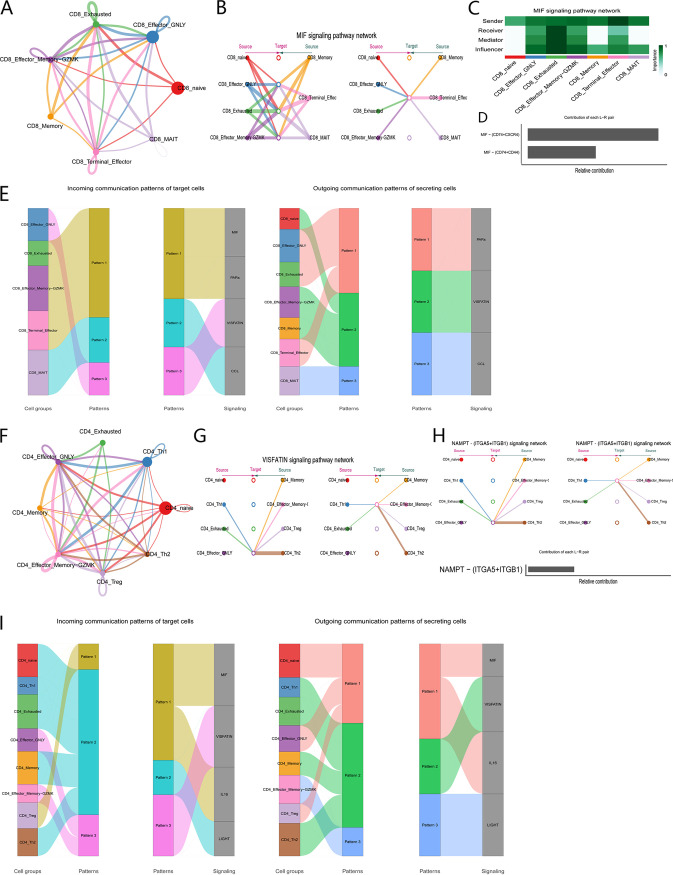
FIG 3.
CellChat analysis of the communications between each cell subset of CD8+ and CD4+ T cells. (A) Cell communication among subsets of CD8+ T cells. (B) Hierarchical plot showing the inferred intercellular communication network for the MIF signaling pathway. (C) Heatmap showing the relative importance of each cell subset based on four network centrality measures of the MIF signaling network. (D) Relative contribution of each ligand–receptor pair to the MIF signaling pathway. (E) Inferred incoming (right) and outgoing (left) communication patterns of target and secreting cells of CD8+ T cells, respectively. (F) Cell communication among subsets of CD4+ T cells. (G) Hierarchical plot showing the inferred intercellular communication network for the VISFATIN signaling pathway. (H) Relative contribution of each ligand–receptor pair to the VISFATIN signaling pathway. (I) Inferred incoming (right) and outgoing (left) communication patterns of target cells and secreting cells of CD4+ T cells, respectively.

