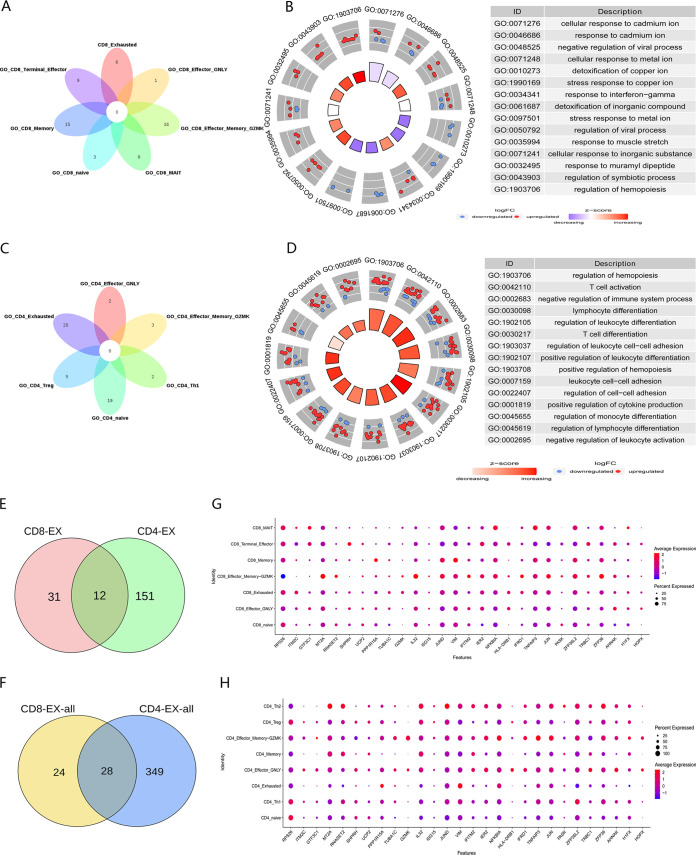
FIG 4.
Common features of exhausted cells. (A) Venn diagram showing the intersection of biological processes of each CD8+ T-cell subset. (B) Chordal diagram showing the biological process enrichment of CD8+ T-cell exhaustion subsets. (C) Venn diagram showing the intersection of biological processes of each CD4+ T-cell subset. (D) Chordal diagram showing the biological process enrichment of CD4+ T-cell exhaustion subsets. (E) Venn diagram showing the intersection of genes with significant differences between CD8+ and CD4+ T-exhausted cells. (F) Venn diagram showing the intersection of differentially expressed genes of CD8+ and CD4+ T-exhausted cells. (G and H) Dot plots showing the cell expression ratios of T-cell exhaustion genes in each subset of CD8+ T cells (G) and CD4+ T cells (H).

