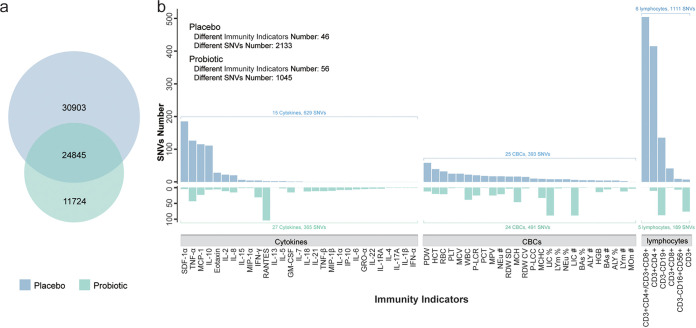
FIG 5.
Comparison of the SNVs generated during the intervention in the probiotic group and placebo group. (a) The Venn diagram of SNVs was generated in the placebo group and probiotic group. The intersection is considered to be the consequence of time development instead of different treatment. (b) Comparison of immunity-related SNVs between the two groups. The unique SNVs in the probiotic or placebo group were associated with the changes of 69 immunity indicators and are illustrated by bar plots.

