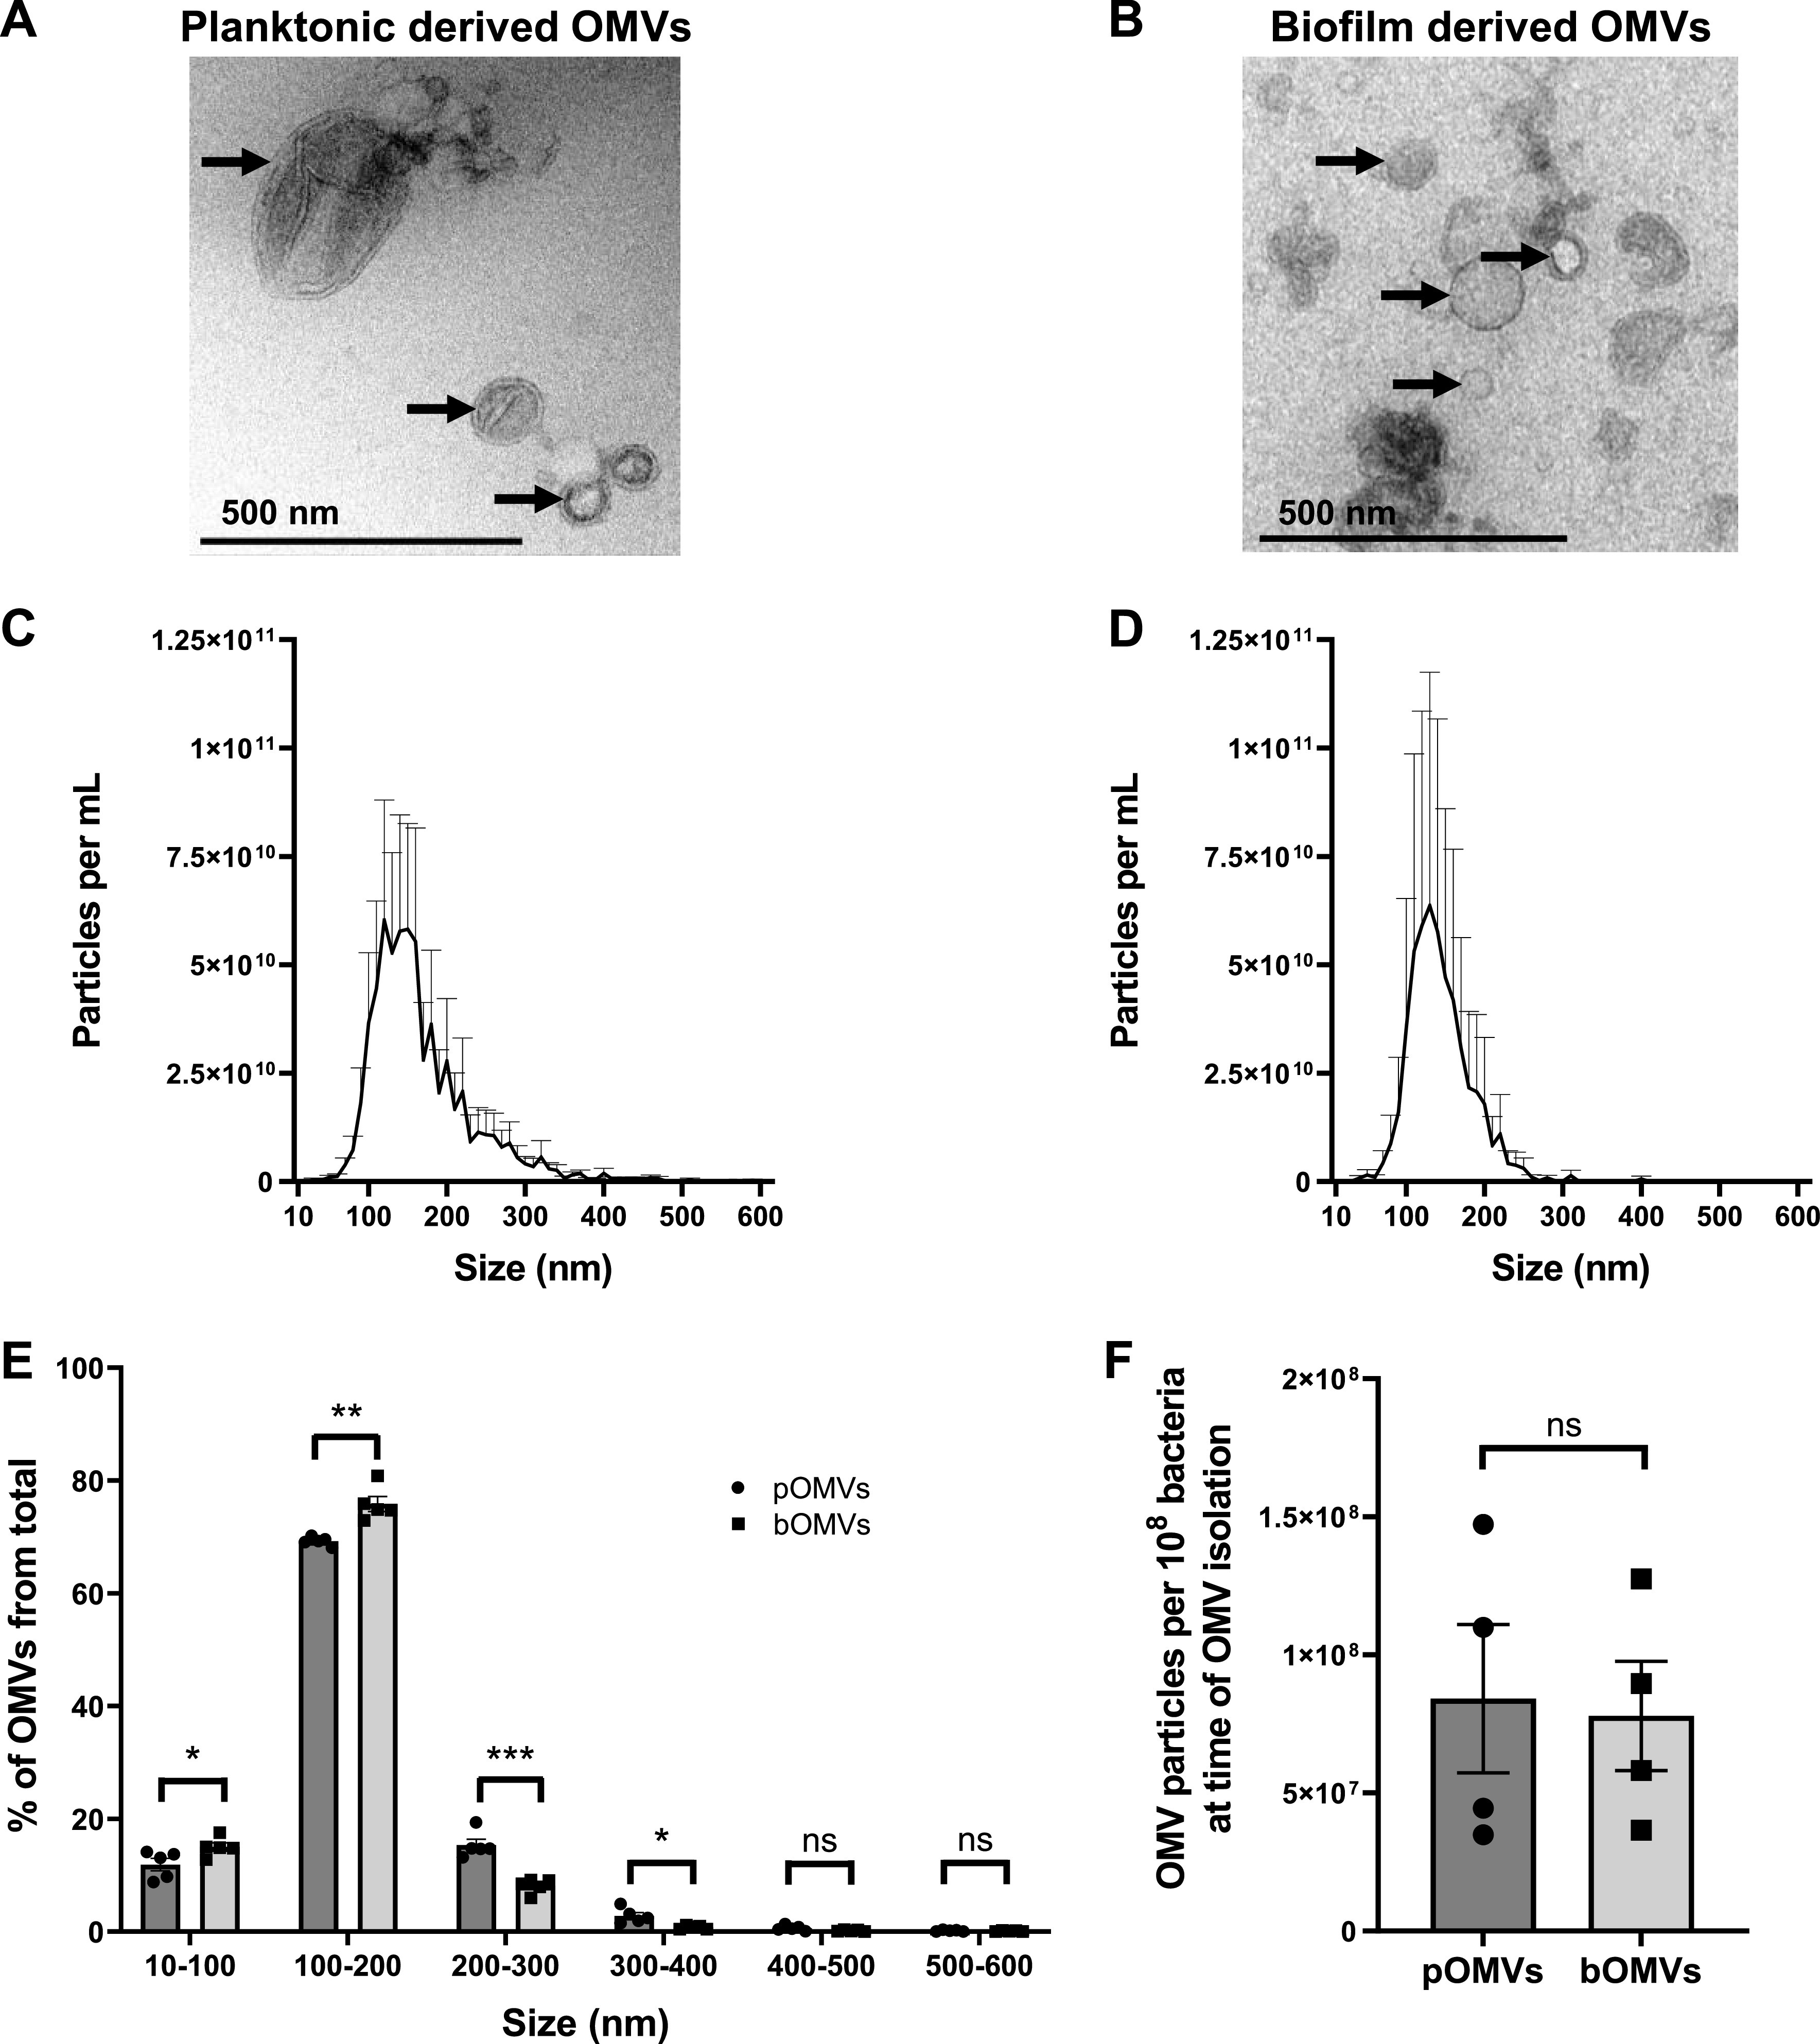
FIG 3.

P. aeruginosa PAO9503 OMVs produced during biofilm growth are smaller than planktonic-derived P. aeruginosa PAO9503 OMVs. (A and B) Transmission electron micrographs of PAO9503 pBBR1MCS-5 planktonic derived OMVs (A) and PAO9503 pBBR1MCS-5 biofilm derived OMVs (B). Scale bar, 500 nm. Images are representative of n = 3 biological replicates. Arrows indicate OMVs. (C and D) ZetaView NTA of OMVs isolated from PAO9503 pBBR1MCS-5 planktonic (C) or biofilm (D) cultures. Data shown are means + SEM of n = 5 biological replicates. (E) The size range of P. aeruginosa PAO9503 planktonic derived OMVs (pOMVs, circles) and biofilm derived OMVs (bOMVs, squares), represented as a percentage of the total OMV population. pOMVs are represented by circles (dark gray bars), and bOMVs are represented by squares (light gray bars). Data are presented as means ± SEM of n = 5 biological replicates. *, P < 0.05; **, P < 0.01; ***, P < 0.001; ns, not significant (Student's t test). (F) The number of P. aeruginosa PAO9503 pOMVs (circles, dark gray bar) and bOMVs (squares, light gray bar) per 108 bacteria in individual cultures at the time OMVs were collected was determined by NTA. Data are means ± SEM of n = 4 biological replicates. ns, not significant (Student's t test).
