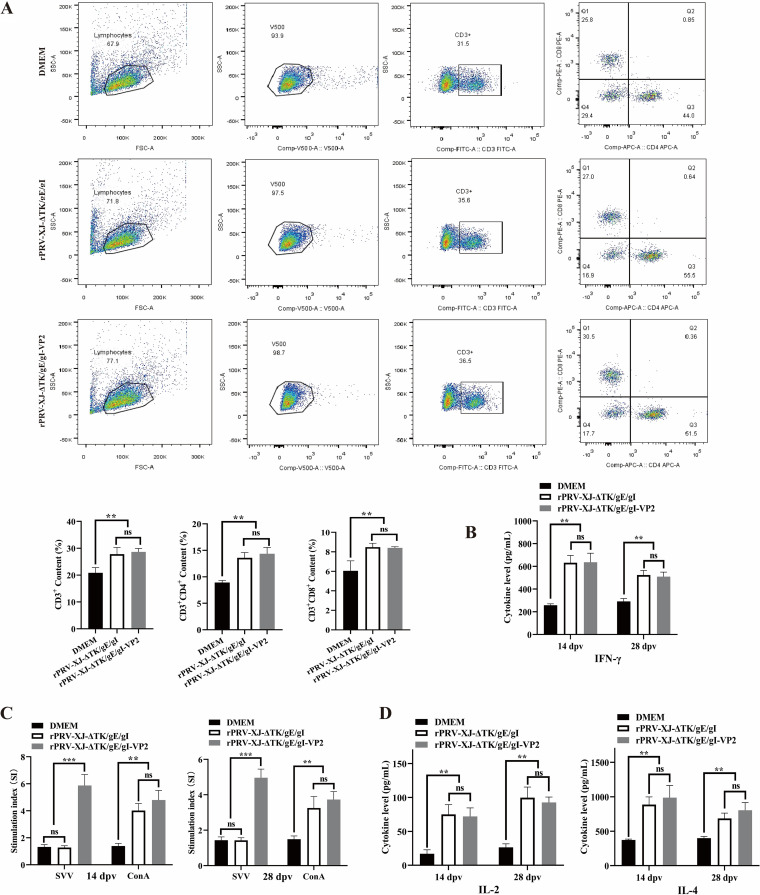
FIG 5.
Cell immune responses analyses of rPRV-XJ-ΔTK/gE/gI, rPRV-XJ-ΔTK/gE/gI-VP2, and DMEM groups. (A) Representative gating strategy for T cells and the flow cytometry analysis result of CD3+, CD3+ CD4+, and CD3+ CD8+ T cell populations at 14 dpv after vaccination. (B) The serum IFN-γ was detected by ELISA. (C) Splenic lymphocyte-specific proliferative responses assay. (D) The serum IL-2 and IL-4 were detected by ELISA. Data are presented as mean ± SD (n = 3); **, P < 0.01; ***, P < 0.005.

