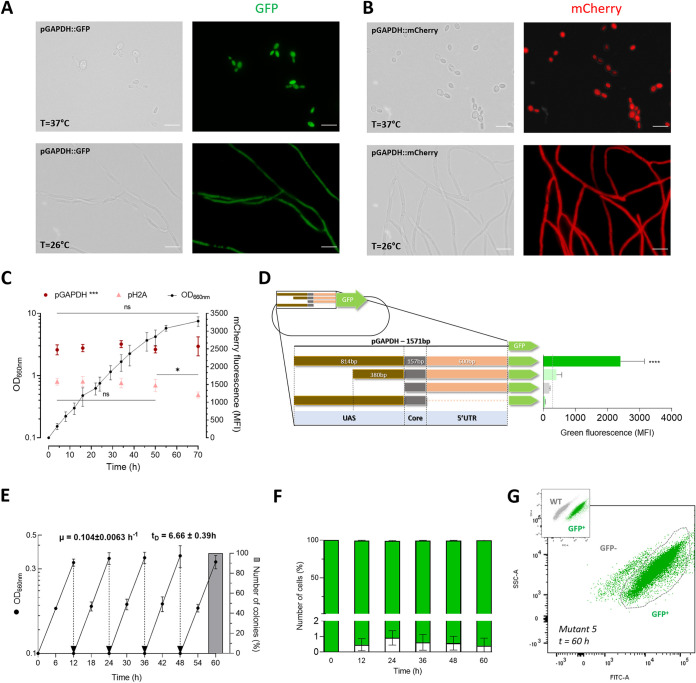
FIG 2.
Mitotic stability and promoter evaluation of different S. brasiliensis transformants through sGFP and mCherry gene expression. The scale bar equals 10 μm for all images. (A) Fluorescence microscopic analysis of the green fluorescent S. brasiliensis tagged strain, expressing sGFP during yeast and mycelium phases through the Bright field and FITC channels. (B) Fluorescence microscopic analysis of the red fluorescent S. brasiliensis tagged strain, expressing mCherry in the cytoplasm during both yeast and mycelium phases through the Bright field and TRITC channels. (C) Differences between pGAPDH and pH2A promoters in S. brasiliensis mCherry expression, along a batch growth culture. Data depicts the mean of OD660nm ± SD, illustrated as dots, correlated with the mean of MFI expressed by pGAPDH and pH2A promoters through time, demonstrated as dots and triangles, respectively. (***, P = 0,0001; *, P < 0.5; n = 6). Two-way ANOVA determined statistically significant data by Sidak's multiple-comparison test (***, P < 0.001; *, P < 0.5; n = 5). (D) The difference in sGFP expression driven by different lengths of the GAPDH promoter. The GAPDH is a TATA less promoter, and region of 1,571 bp upstream of the start codon was considered full-length promoter. Successive deletion of nucleotides −1,571 to −1,137, −1,571 to −757, and −584 to −1 from the starting codon were used to evaluate the presence of essential acting elements related to transcription activity located within these regions. The wild-type S. brasiliensis autofluorescence threshold is indicated by the traced line. Bars depict the mean ± SD number of MFI per condition, namely, S. brasiliensis tagged strains with the expression of sGFP through the activity of different lengths of the GAPDH promoter as schematically represented. One-way ANOVA determined statistically significant data by Dunnett's multiple-comparison test (****, P < 0.0001; n = 5). (E) Growth profile of five randomly selected tag-strain colonies, in a nonselective medium, with five consecutive dilutions. The data represent means of OD660nm ± SD after five restreaks of 12 h of incubation (n = 5), with the exponential growth rate (μ) and duplication time (TD). The gray column represents the percentage of resistant colonies to hygromycin B after 60 h from 100 colonies from 10 randomly selected clones. (F) Percentage of cells expressing sGFP across all five consecutive cultivations, each with a twelve-hour growth period in a nonselective medium. Bars depict the mean MFI ± SD percentage of negative cells per restreak (n = 5). (G) Dot plot of side scatters (SSC-A LOG) versus green fluorescence intensity (FITC-A). The upper left inset plot shows the differences in green fluorescence intensity between sGFP-tagged strains and the wild type. These differences were used to define the gating strategy. The dot plot represents the data obtained after 60h of growth in a nonselective medium.

