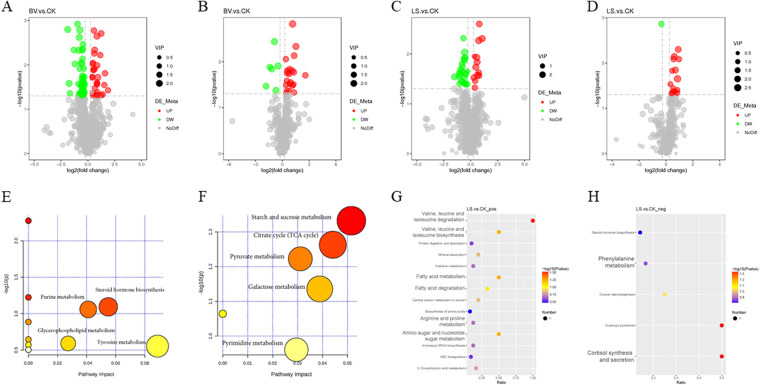
FIG 6.
The differential metabolites in intestinal metabolomics. (A to D) Volcano map of differential metabolites. (A and C) Positive ionization mode; (B and D) negative ionization mode. The horizontal coordinate represents the multiple change of difference (log2 fold change) of metabolites in different groups, and the vertical coordinate represents the significance level of difference (–log10 P value). Each point in the volcano map represents a metabolite, and the significantly upregulated metabolites are represented by red dots, while the significantly downregulated metabolites are represented by green dots. The dot size represents the VIP value. (E to H) KEGG enrichment pathway; (E and G) positive ionization mode; (F and H) negative ionization mode.

