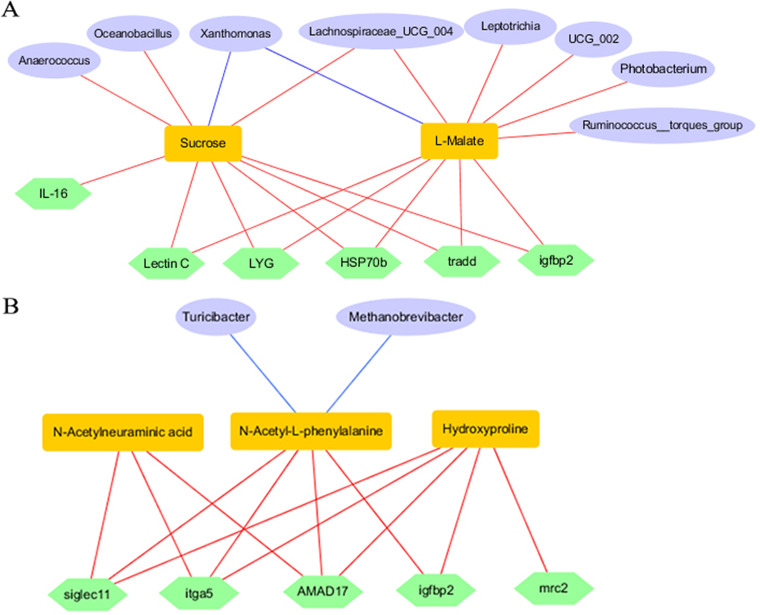
FIG 7.
Combined analysis of microflora, metabolites, and expression of genes. (A) The correlation in the B. velezensis group. (B) The correlation in the L. sakei group. The red and blue lines show the significant positive and negative correlations, respectively, among microflora, metabolites, and expression of genes (P < 0.05).

