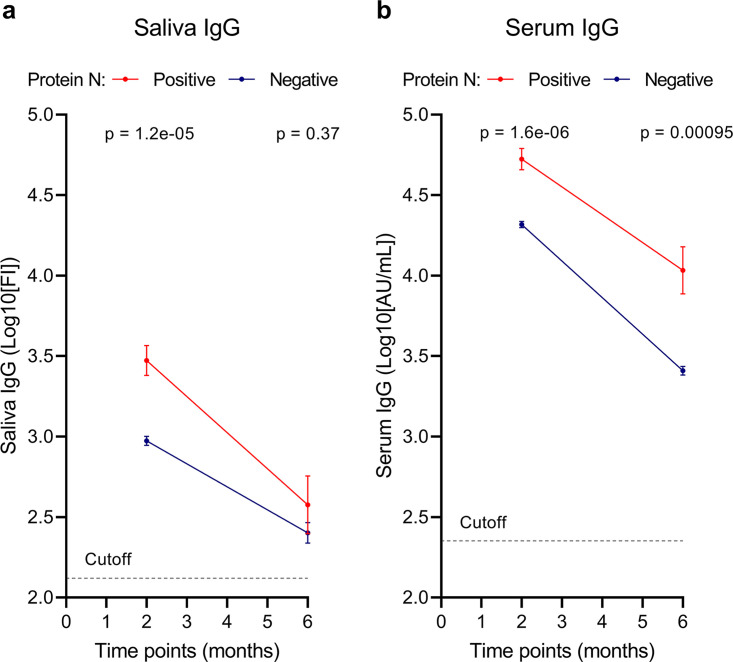
FIG 1.
Evolution of IgG levels in saliva and serum 2 and 6 months after the first vaccine dose. IgG levels in saliva (a) and serum (b) 2 and 6 months after the first vaccine dose. The dashed line shows the cutoff for assay positivity. The blue line represents individuals with natural SARS-CoV-2 infection based on antibodies against N protein. The red line represents SARS-CoV-2 infection-naive individuals based on the absence of antibodies against N protein. Error bars show SEM. P values represent differences between infected and uninfected individuals. P values of <0.05 are considered significant.

