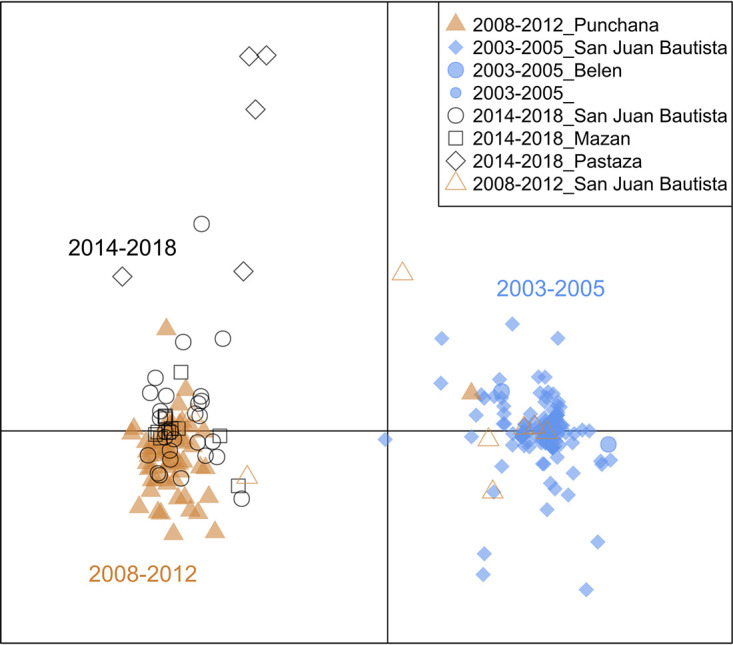
FIG 5.

Discriminant analysis of principal components (DAPC). A scatterplot of discriminant analysis eigenvalues 1 and 2 using all biallelic SNPs in the core targeted region (excluding amplicons targeting repetitive regions and nonnuclear targets) shows the differentiation between Peruvian P. falciparum samples collected before 2008 and those collected afterward (x axis) (PC1) and a subsequent separation along the y axis (PC2) from 2014 to more recent years and along geographic distance. DAPC calculates the discriminant components using predefined populations in such a way that samples from the same population will be grouped, while it simultaneously maximizes the distance with samples from other populations. SNPs contributing most to the DAPC are listed in Table S13 in the supplemental material. DAPC was performed with 40 principal components and 7 discriminants as determined by cross-validation. The increased resolution of the DAPC allowed the detection of greater genetic variation in samples from 2014 to 2018 (black shapes) than with the lineage analysis.
