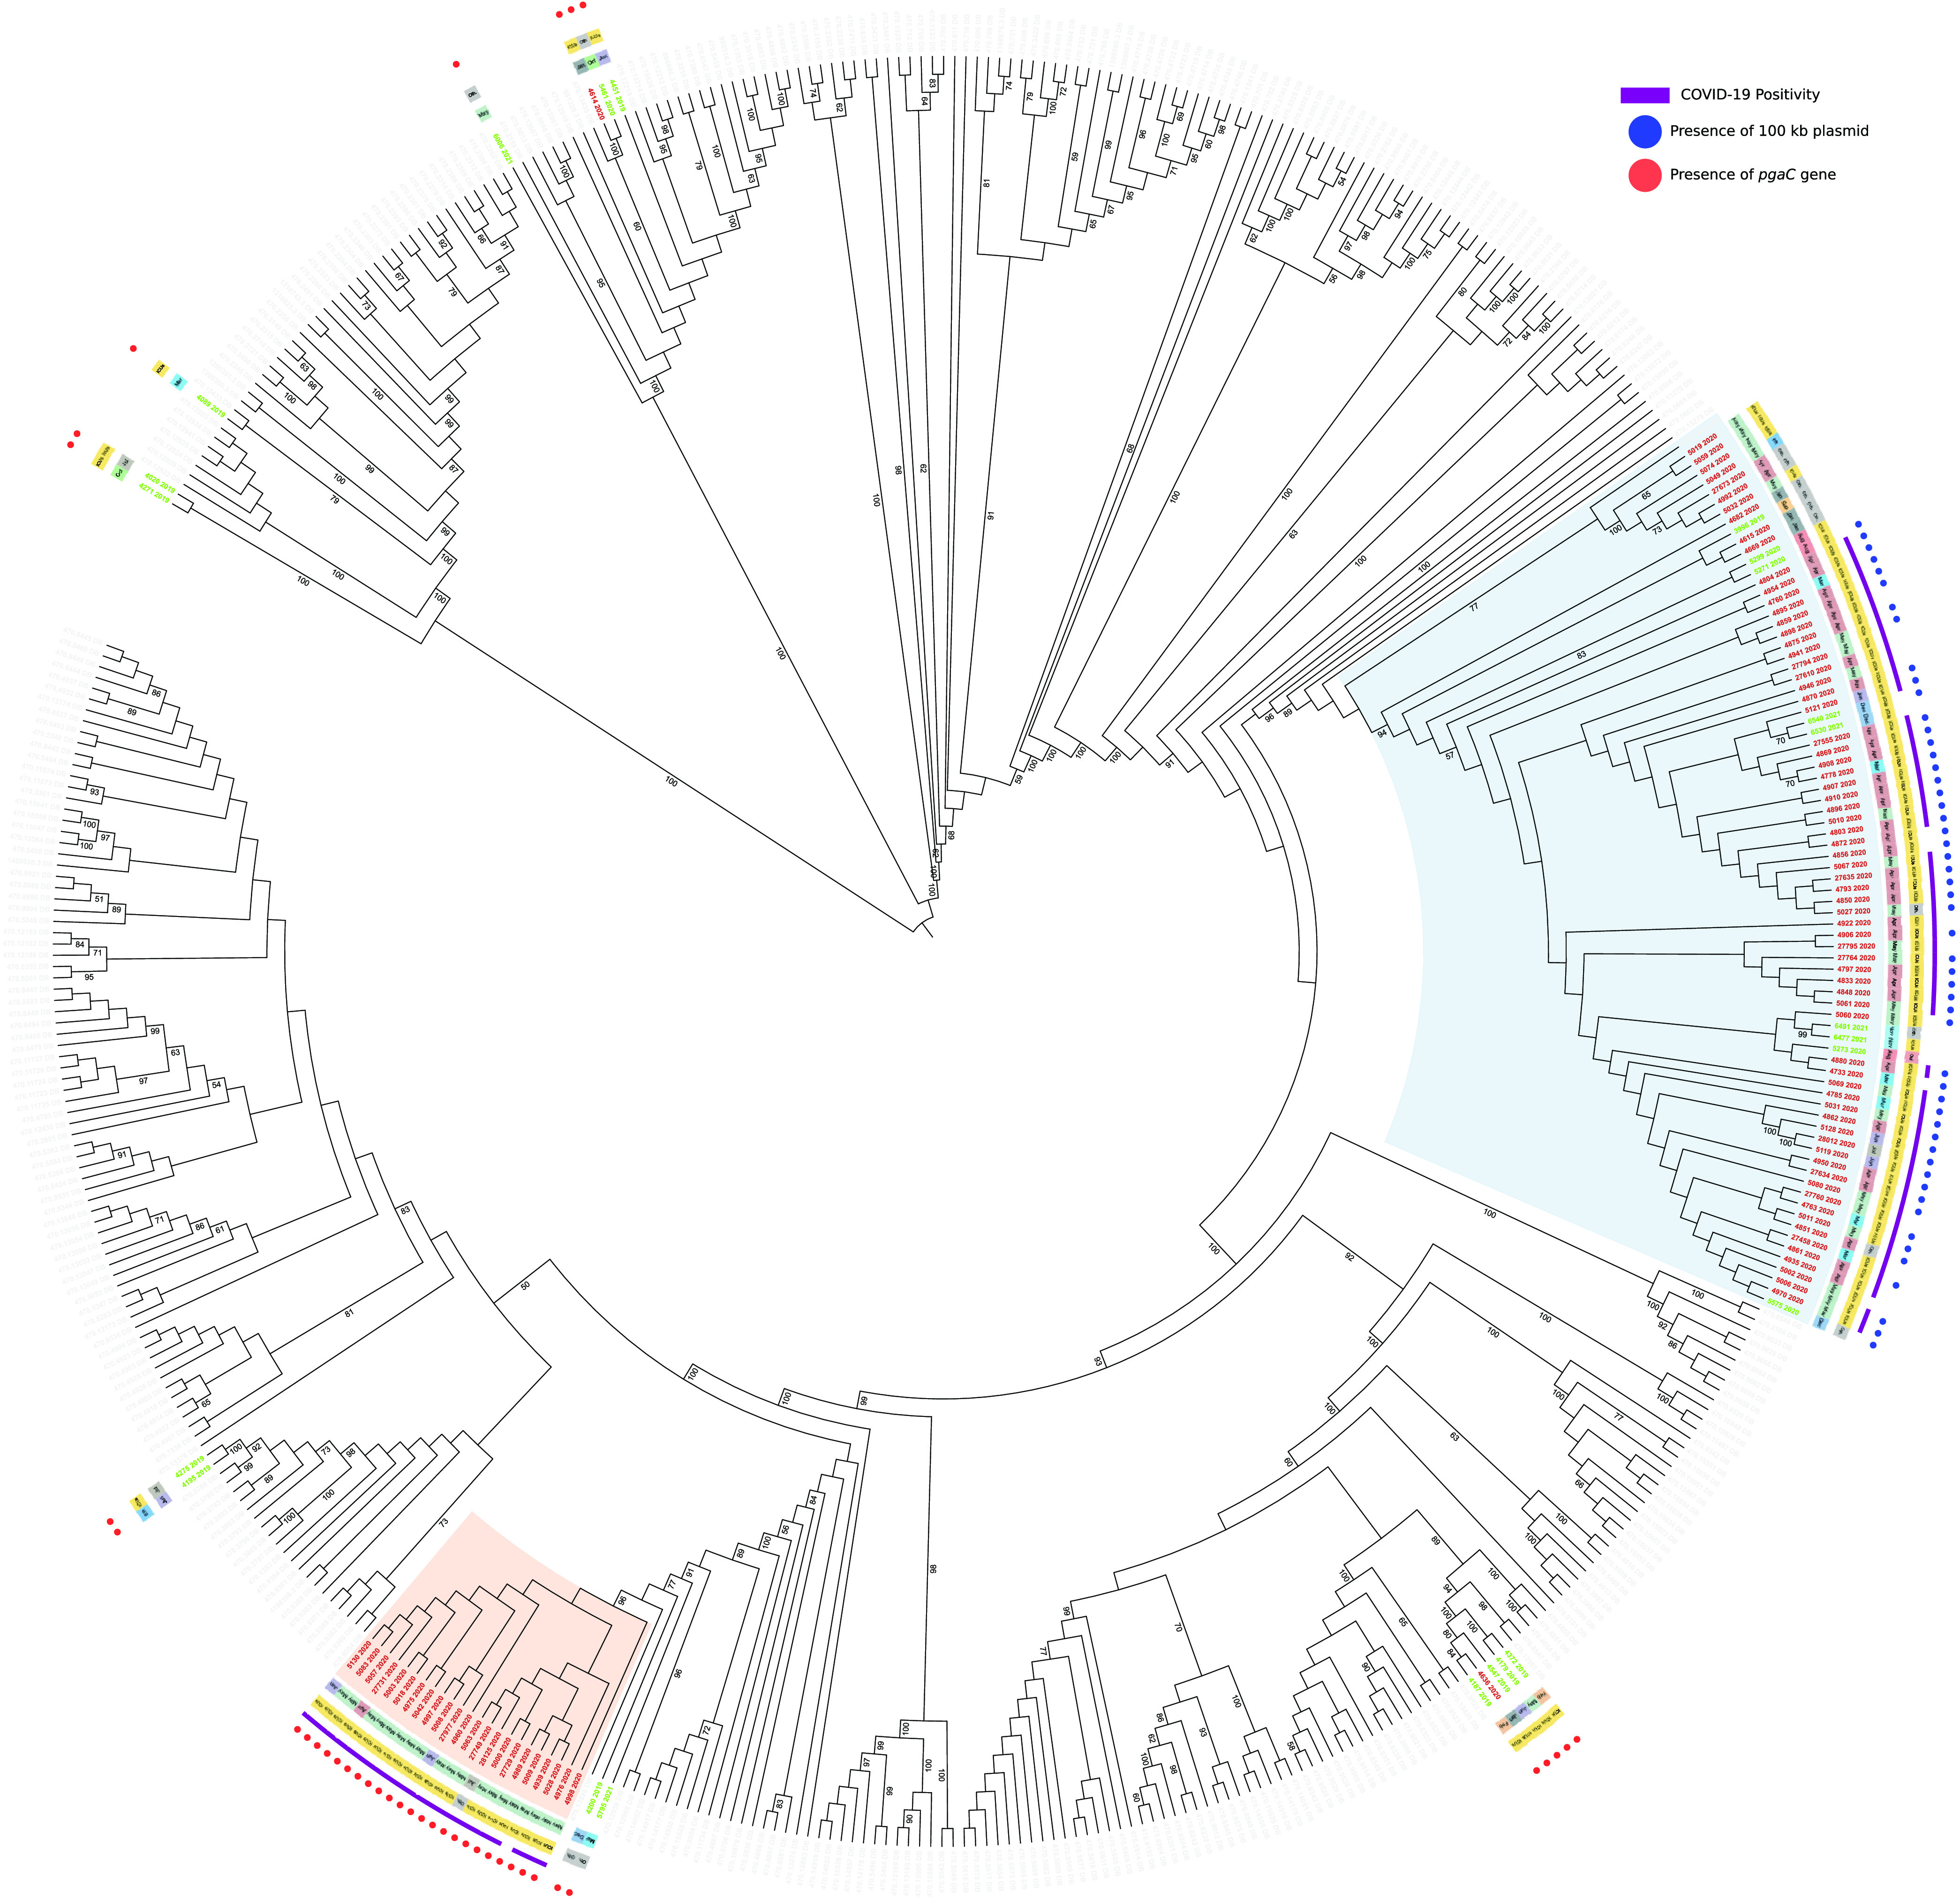
FIG 1.

Maximum-likelihood phylogeny of 485 A. baumannii strains, including 95 outbreak genomes (red labels), 23 surveillance genomes (green labels), and 367 PATRIC genomes (gray labels) inferred on coreSNPs with RAxML. Date of isolation (innermost crown), ward (second crown), and SARS-CoV-2 positivity (third crown) were retrieved from the hospital and microbiological database. The presence of 100-kbp plasmid (blue dots) and pgaC gene (red dots) were determined by genomic analyses. The two main outbreak clusters are highlighted in blue (cluster 1) and red (cluster 2). Bootstrap values above 50/100 are indicated on tree branches. This figure was obtained using iTol (https://itol.embl.de/).
