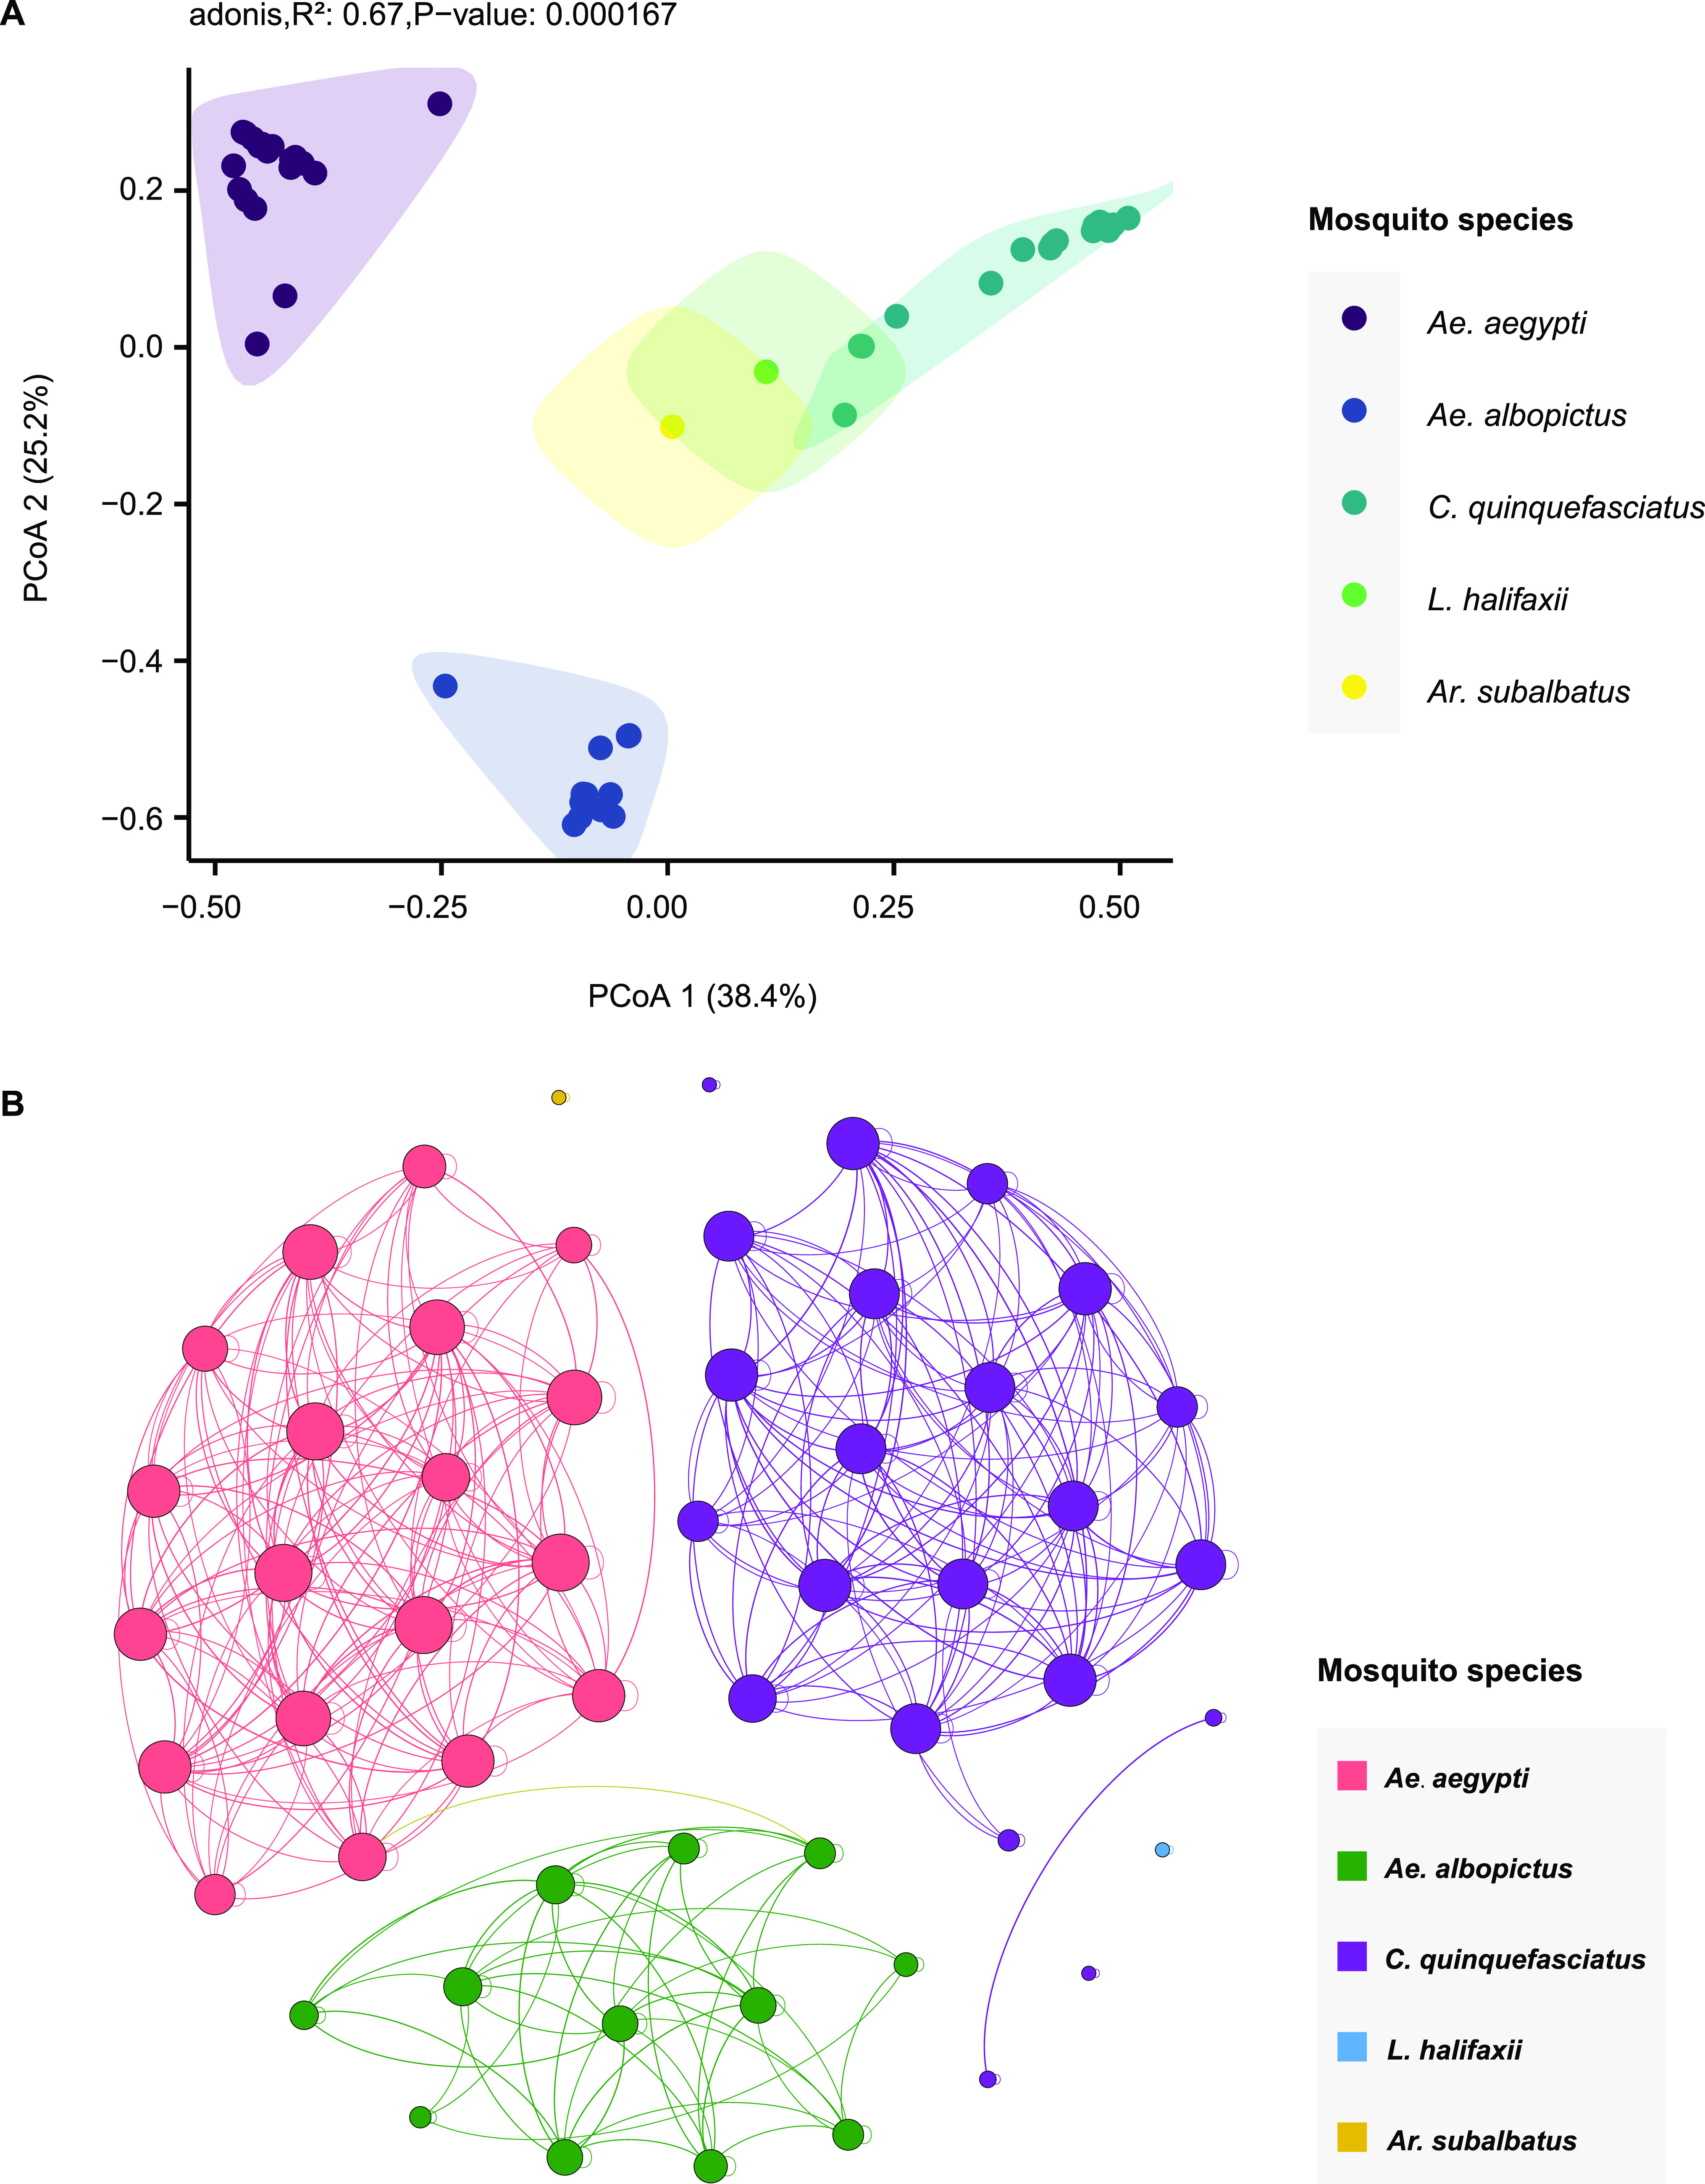
FIG 6.

β-diversity analysis and viral co-occurrence network. (A) β-diversity analysis of the virome composition of different mosquito species; (B) viral co-occurrence network of host taxa. The network was calculated using the relative abundance of each virus across libraries. Each node represents a library. Libraries with a Spearman’s correlation greater than 0.6 (P < 0.05) are connected by edges. The thickness of each edge is determined according to the correlation coefficient; the size of a node is determined by the degree (number of edge connections). The nodes were colored by mosquito species.
