FIG 3.
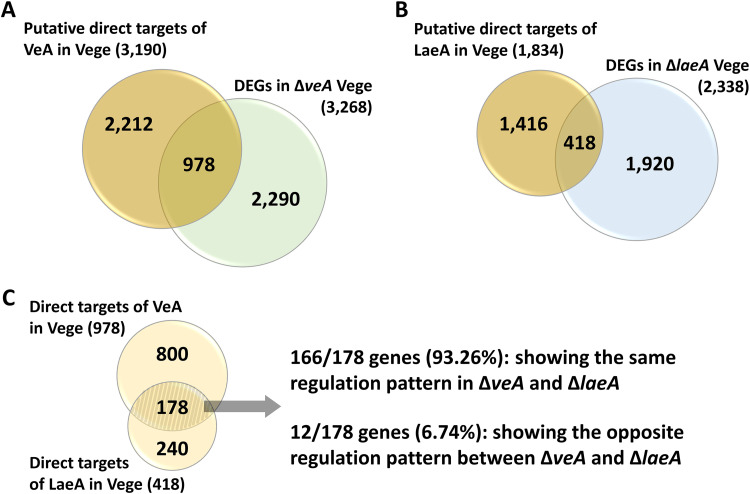
Identification of VeA and LaeA direct targets in A. nidulans. (A) The Venn diagram showing the number of putative direct targets of VeA and DEGs in the ΔveA Vege. The overlapped part in the Venn diagram indicates the number of direct targets of VeA. (B) The Venn diagram showing the number of putative direct targets of LaeA and DEGs in the ΔlaeA Vege. The overlapped part in the Venn diagram indicates the number of direct targets of LaeA. (C) The Venn diagram depicting the number of overlapped direct targets of VeA and LaeA. The 166 genes might be under the direct regulatory control of the VeA/LaeA complex.

