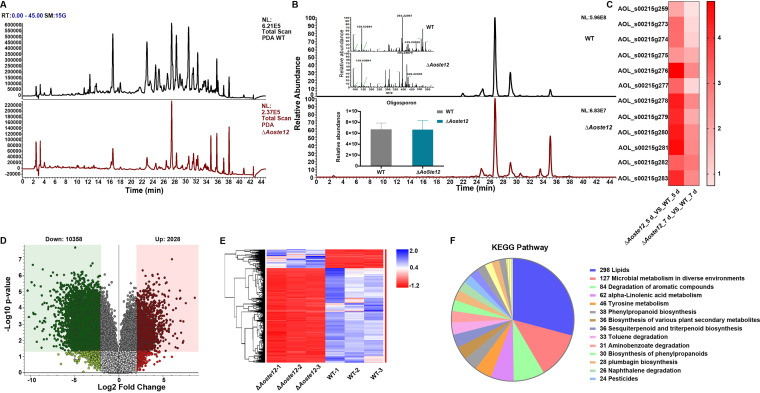
FIG 8.
Comparison of metabolic profiling between wild-type (WT) and ΔAoste12 mutant strains. (A) Comparison of high-performance liquid chromatography (HPLC) profiles of the WT and ΔAoste12 mutant strains. PDA, photo-diode array. (B) Comparison of chromatogram of arthrobotrisin anion peaks of WT and ΔAoste12 mutant strains. Arthrobotrisins were verified via diagnostic ion fragments at m/z 139, 393, and 429 through a mass spectrogram. The histogram showed that the arthrobotrisin content was comparable to the peak area of the WT and ΔAoste12 mutant strains. (C) A heatmap shows the relative transcription levels of genes associated with the biosynthesis of arthrobotrisins in the ΔAoste12 mutant versus the WT strain at different time points. (D) Volcano plot of differential metabolites between WT and ΔAoste12 mutants. (E) Heatmap of upregulated and downregulated metabolic pathways between ΔAoste12 mutant and WT strain determined via KEGG enrichment. (F) Numbers of KEGG pathways in the ΔAoste12 mutant versus the WT strain.

