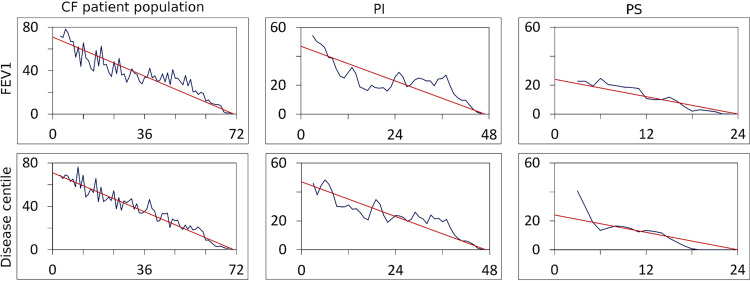
FIG 1.
The CF patient cohort lung function and disease centile distribution matches the centile distribution of the CF registry. Frequency of centile number differences normalized to cohort size (ordinate) is plotted against the rank number difference for the selected patient cohort (in blue) compared to the expected theoretical linear decrease (in red). Graphs represent the FEV1 centile (top) and the disease centile (bottom) for (left to right) the whole cohort and the PI and PS patient subgroups. Patients’ FEV1 and disease centiles were determined by mapping the individuals’ data onto the European CF Registry centiles (41) as a reference. The study cohort’s centile distribution was not significantly different from the expected linear decline.

