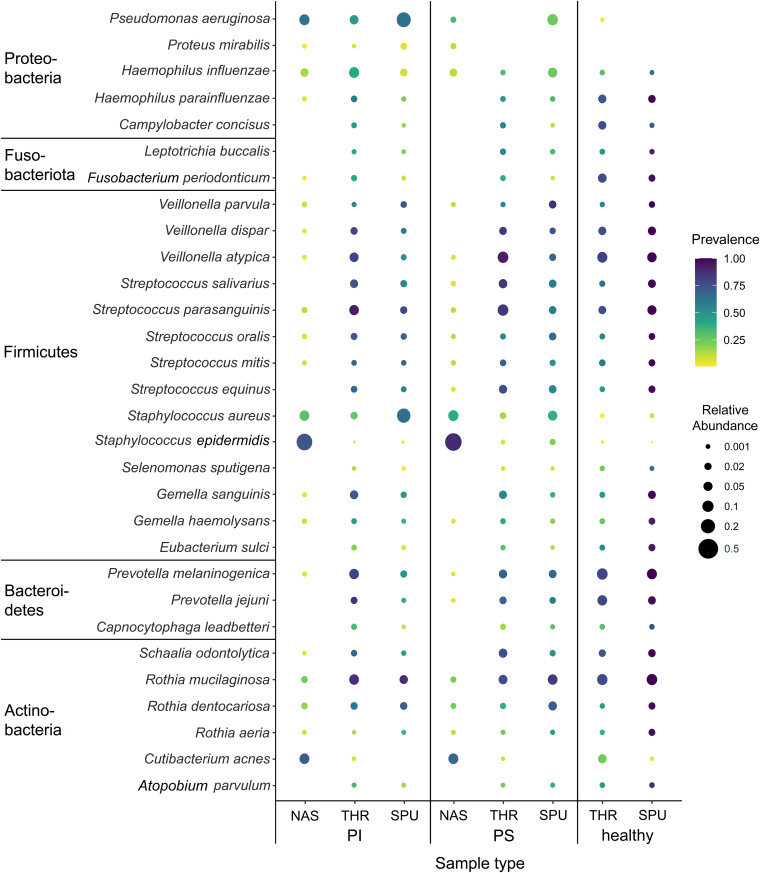
FIG 3.
Bubble graph presentations of the abundance and prevalence of bacteria in airway metagenome data sets in health and cystic fibrosis. Induced sputum (SPU), oropharyngeal swabs (THR), and nasal lavage samples (NAS) were collected from PI CF and PS CF patients and healthy non-CF controls. For each habitat and condition, the area of the circle indicates the mean relative abundance and the color intensity indicates the prevalence of the species within the group. The scales on the right visualize the calibrated color intensity gradient of prevalence and the calibrated range of the abundance. The selected bacterial species account for 90% of the total number of reads among archaebacteria and eubacteria.

