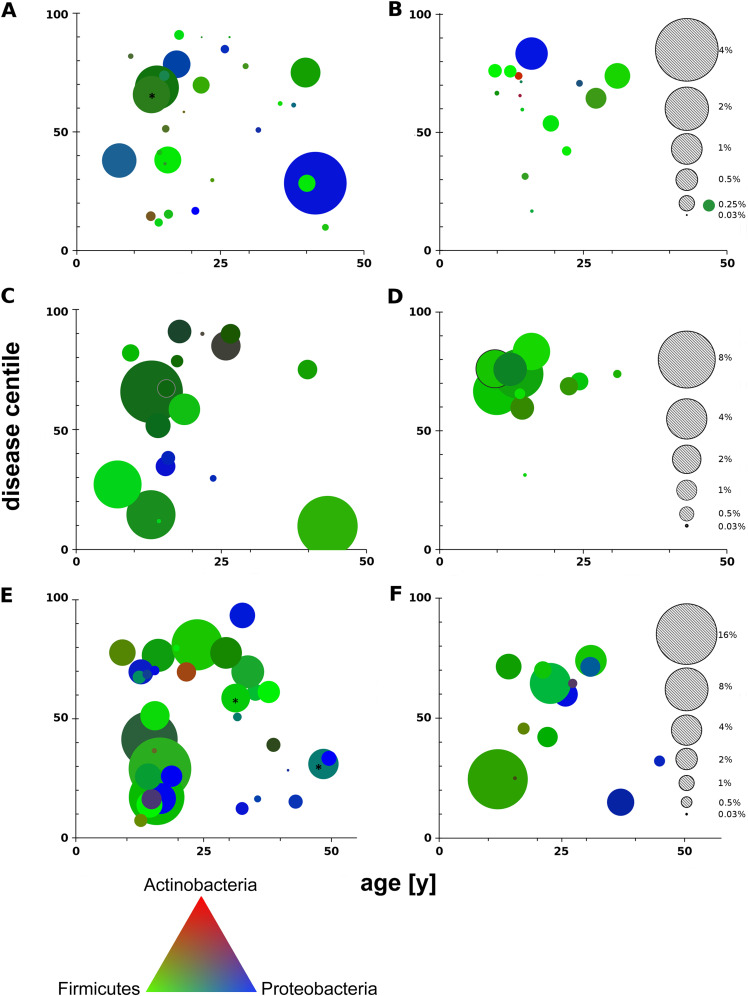
FIG 6.
Microbial load (bacterial reads/total reads) of patients’ samples, represented by dot size, is assigned to the patient’s age (x axis) and disease centile (y axis). The plots visualize the microbial load of nasal lavage samples (A and B), oropharyngeal swabs (C and D) and induced sputa (E and F) collected from PI (left) and PS (right) CF patients. The gray dots indicate the scale of microbial load for each habitat. The RGB color of each dot corresponds to a linear combination of the three dominant phyla: Actinobacteria (red), Firmicutes (green), and Proteobacteria (blue). The triangle at the bottom provides the color reference. Note the different scales for nasal lavage samples, oropharyngeal swabs, and sputa. The dots of the two PI CF sputa with the highest microbial loads, 36% and 40% (asterisks), were reduced by 10-fold (E).

