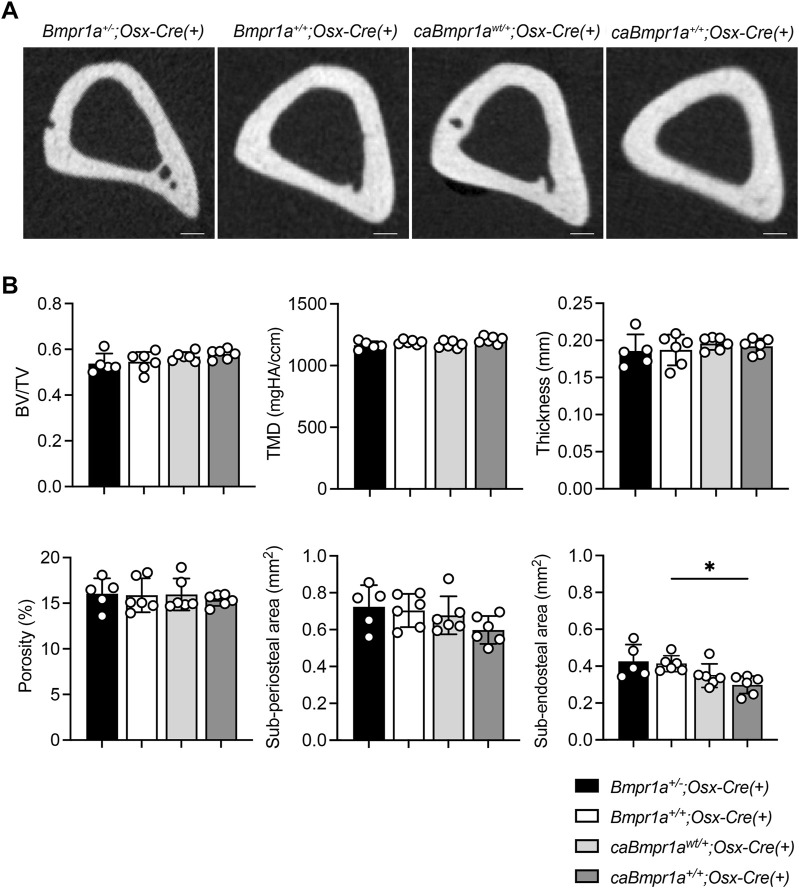
FIGURE 3.
Micro-CT analysis for cortical compartments of the male mouse tibia at 12 weeks of age. (A) Micro-CT based 2D images of the mouse proximal tibia. Scale bar = 200 µm. (B) Bone volume (BV/TV), tissue mineral density (TMD), thickness, porosity, sub-periosteal (total) area and sub-endosteal (marrow) area were analyzed (n = 5 male for Bmpr1a +/− ;Osx-Cre mice, n = 6 male for Bmpr1a +/+ ;Osx-Cre, caBmpr1a wt/+ ;Osx-Cre, caBmpr1a +/+ ;Osx-Cre mice). **p < 0.01.

