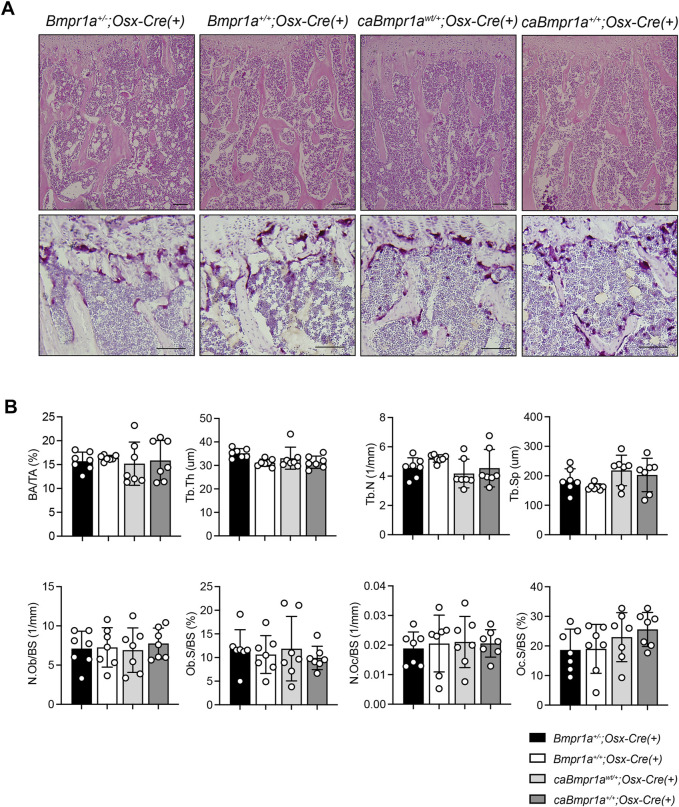
FIGURE 4.
(A) Top, H&E staining of the mouse proximal tibia. Scale bar = 100 µm. Bottom, TRAP staining of the mouse proximal tibia. Scale bar = 50 µm. (B) Bone area/tissue area (BA/TA), trabecular thickness (Tb.Th), trabecular number (Tb.N), trabecular space (Tb.Sp), osteoblast number/bone surface (N.Ob/BS), osteoblast surface/bone surface (Ob.S/BS), osteoclast number/bone surface (N.Oc/BS), osteoclast surface/bone surface (OcS/BS) were analyzed (n = 7 male for each group). ***p < 0.001, **p < 0.01.

