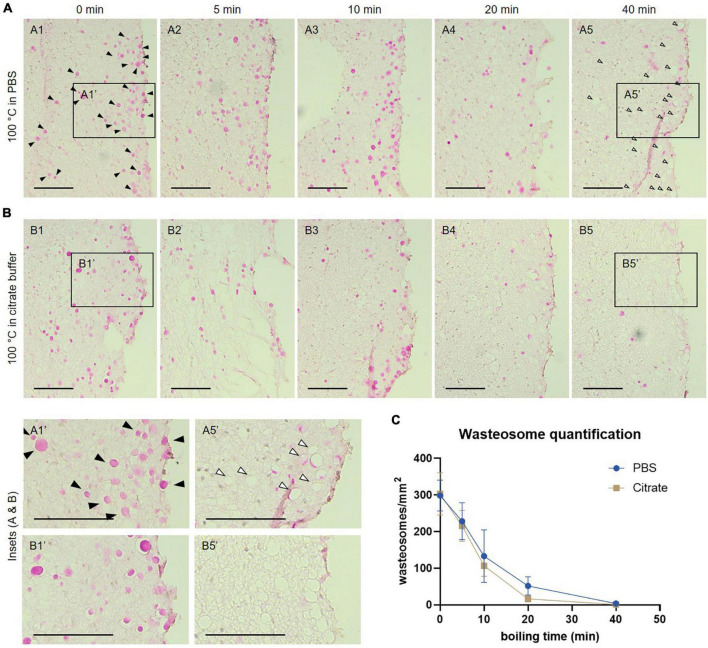
FIGURE 2.
(A) Representative images of consecutive hippocampal sections (equivalent regions) from an Alzheimer’s disease (AD) patient boiled in PBS and stained with the periodic acid-Schiff (PAS) method. Samples were boiled in PBS for 0 (A1), 5 (A2), 10 (A3), 20 (A4) or 40 min (A5) before staining. (B) Representative images of consecutive hippocampal sections (equivalent regions) from an AD patient boiled in citrate buffer and stained with the PAS method. Samples were boiled in citrate buffer for 0 (B1), 5 (B2), 10 (B3), 20 (B4) or 40 min (B5) before staining. In A1, some wasteosomes stained with PAS are indicated by black arrowheads. Empty arrowheads in A5 indicate empty spaces compatible with dissolved or detached wasteosomes. A1′, A5′, B1′, and B5′ are the insets from A1, A5, B1 and B5, respectively. Scale bars: 100 μm. (C) Wasteosomes density at different boiling times with PBS or citrate buffer (mean ± SEM, n = 6 for each point). A decrease of the density of wasteosomes can be observed when boiling time increases. See text for details.

