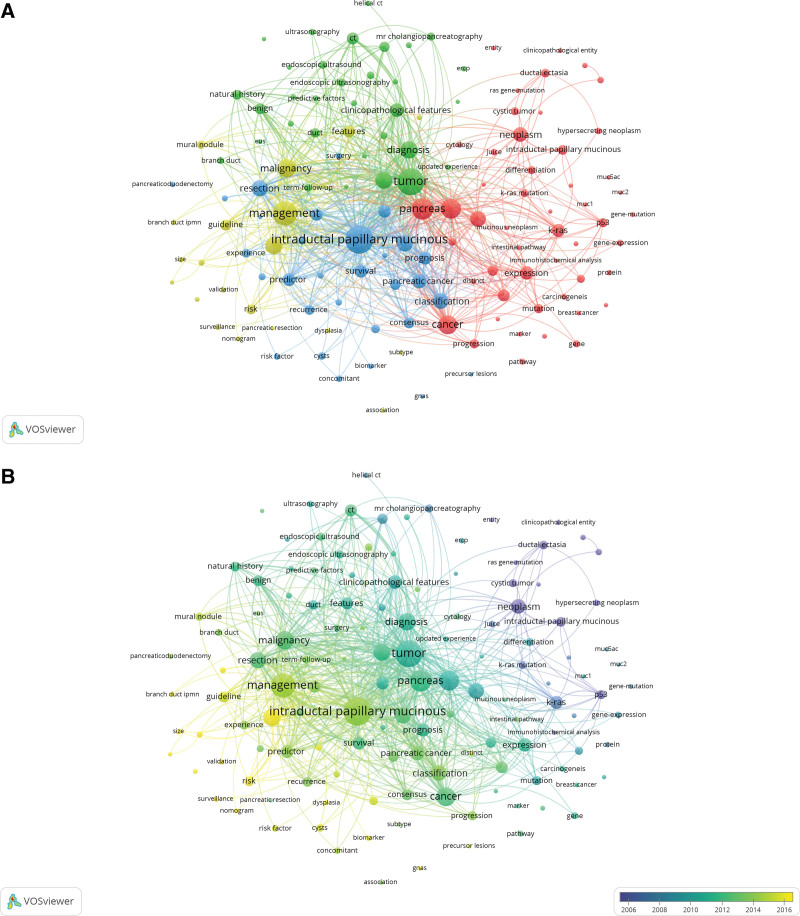
Figure 3.
(A) The network visualization of keywords co-occurrence with frequency more 10 times. Circles with the same color belong to the same cluster. (B) The overlay visualization map of keywords based on the time of appearance. While the earliest nodes were painted with purple, the most recent ones were colored with yellow.

