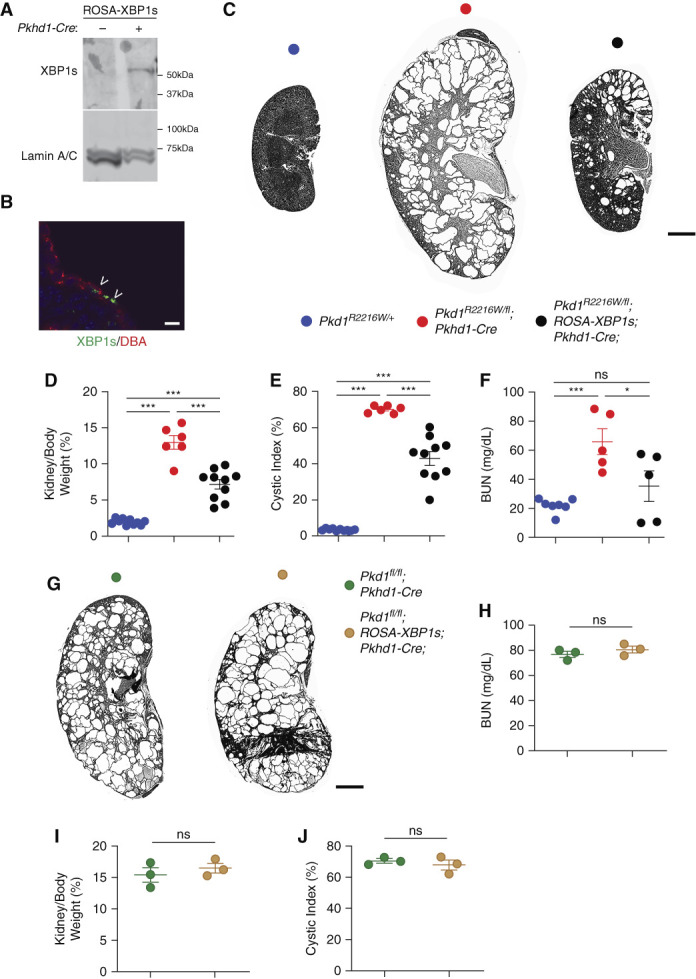
Figure 2.

XBP1s expression slows down disease progression in Pkd1R2216W/flox;Pkhd1Cre mice. (A and B) Nuclear XBP1s expression in the kidneys of Pkd1R2216W/flox in the absence or presence of Pkhd1-Cre at P16 observed by immunoblotting of nuclear fraction from (A) kidney tissue lysates or (B) immunofluorescence (green, indicated by arrowheads) in DBA-positive (red) collecting duct segments. Scale bar, 10 μm. (C) Representative images of kidneys with the genotypes indicated by the color key at P16. Scale bar, 2 mm. (D–F) Aggregate data from mice with the genotypes indicated by the color codes from (C) at P16 showing significant reversal in kidney weight/body weight ratio (KW/BW), cystic index, and BUN levels in the presence XBP1s expression; ***P<0.001; **P<0.01; *P<0.05. Comparisons among groups were performed using one-way ANOVA followed by Tukey’s multiple group comparison post test. (G) Representative images of kidneys with the genotypes indicated by the color key at P24. Size bar, 2 mm. (H–J) Aggregate data from mice with the genotypes indicated by colors in (G).
