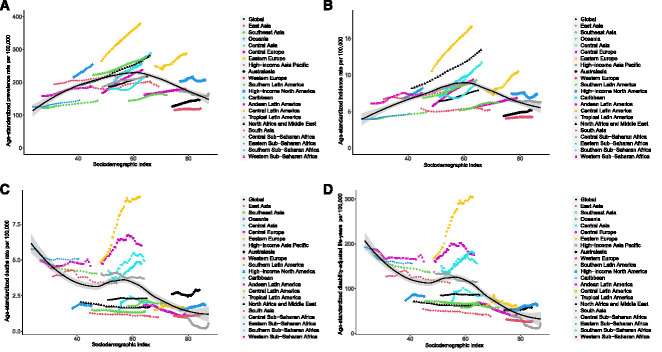
Figure 4.
Correlations between burden of CKD due to glomerulonephritis and the sociodemographic index. Age-standardized incidence (A), prevalence (B), deaths (C), and DALYs (D) rates per 100,000 population of CKD due to glomerulonephritis in 21 regions, by sociodemographic-index, 1990–2019. Black line and gray ribbon represent expected values of each disease rate and its corresponding 95% confidence interval on the basis of the sociodemographic index in all locations.

