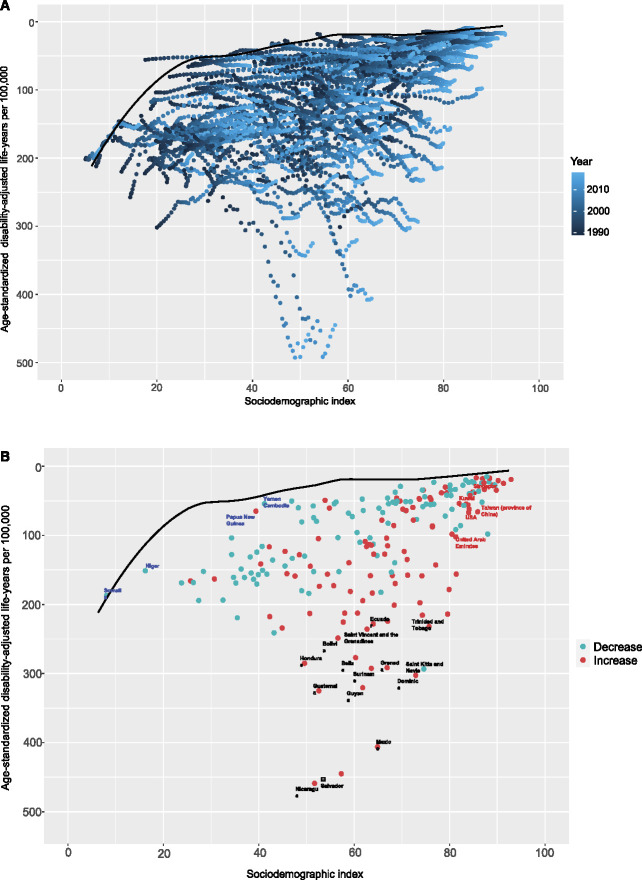
Figure 6.
Frontier analysis on the basis of sociodemographic-index and age-standardized DALYs per 100,000 of CKD due to glomerulonephritis from 1990 to 2019. The frontier line is delineated in black, indicating the potentially achievable age-standardized DALYs on the basis of sociodemographic-index; dots represent the actual age-standardized DALYs in every country and territory. Color scale represents the years from 1990 depicted in dark blue to 2019 in light blue. (A) Frontier analysis on the basis of sociodemographic-index and age-standardized DALYs per 100,000 of CKD due to glomerulonephritis in 2019. The increase in age-standardized DALYs from 1990 to 2019 is shown in red dots, whereas the decrease in green dots. The frontier line, representing the potentially achievable age-standardized DALYs on the basis of sociodemographic-index, is portrayed in black. The top 15 countries with the highest effective difference are labeled in black; the top five countries with the lowest effective difference in low sociodemographic index (<50) are labeled in blue, whereas the highest effective difference in high sociodemographic index (>85) are labeled in red (B).

