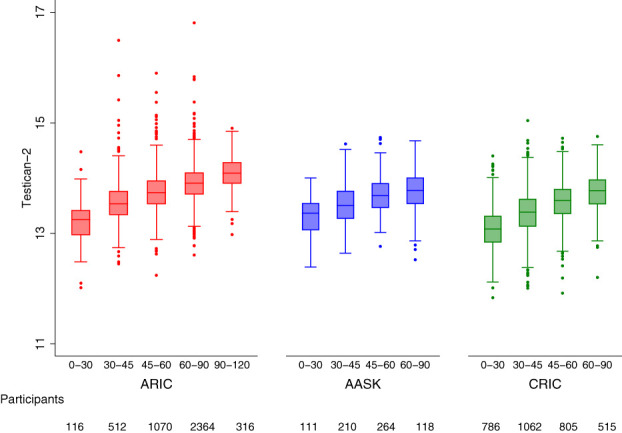
Figure 1.

Testican-2 levels and GFR. Box and whisker plots showing the cross-sectional relationship between baseline eGFR (mGFR in AASK) and testican-2 levels in the ARIC study (left), AASK (middle), and the CRIC study (right). The x-axes show eGFR or mGFR categories in ml/min per 1.73 m2.
