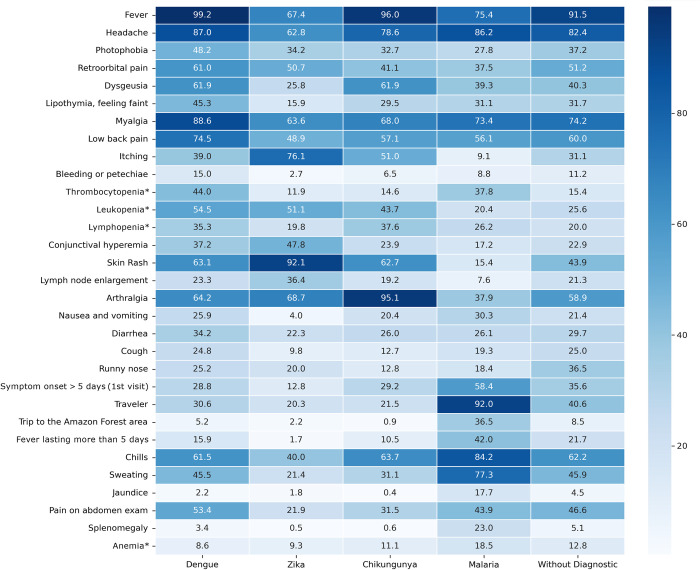
Fig 3. Comparison of the frequency (%) of clinical and laboratory findings reported at the first visit, according to the result of the etiological investigation (N = 3360).
Co-infections and diagnosis with n ≤ 200 not included in this clinical description. Chi-square test showed significant differences among study groups: p<0.001 for all variables except for diarrhea (p = 0.003). * See S1 Table for the definition of anemia, leukopenia, lymphopenia and thrombocytopenia definitions used.

