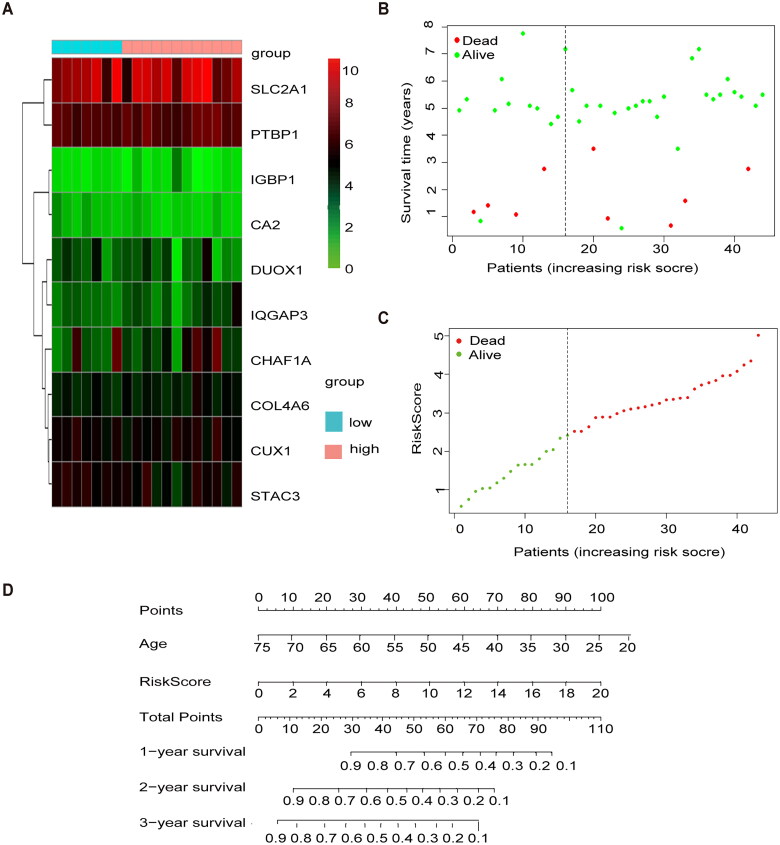
Figure 4.
External validation of methylation models by GSE3900. (A) Heat map of 10 differential gene expressions between high- and low-risk scoring groups in GSE39001. (B) Risk score scatter plot. Red dots indicate dead patients and green dots indicate living patients in GSE39001. (C) Risk score curve graph in GSE39001. Green curves indicate low-risk group and red curves indicate the high-risk group. Alive. (D) Establishing a column line graph based on prognostic features to predict OS in cervical cancer in GSE39001.

