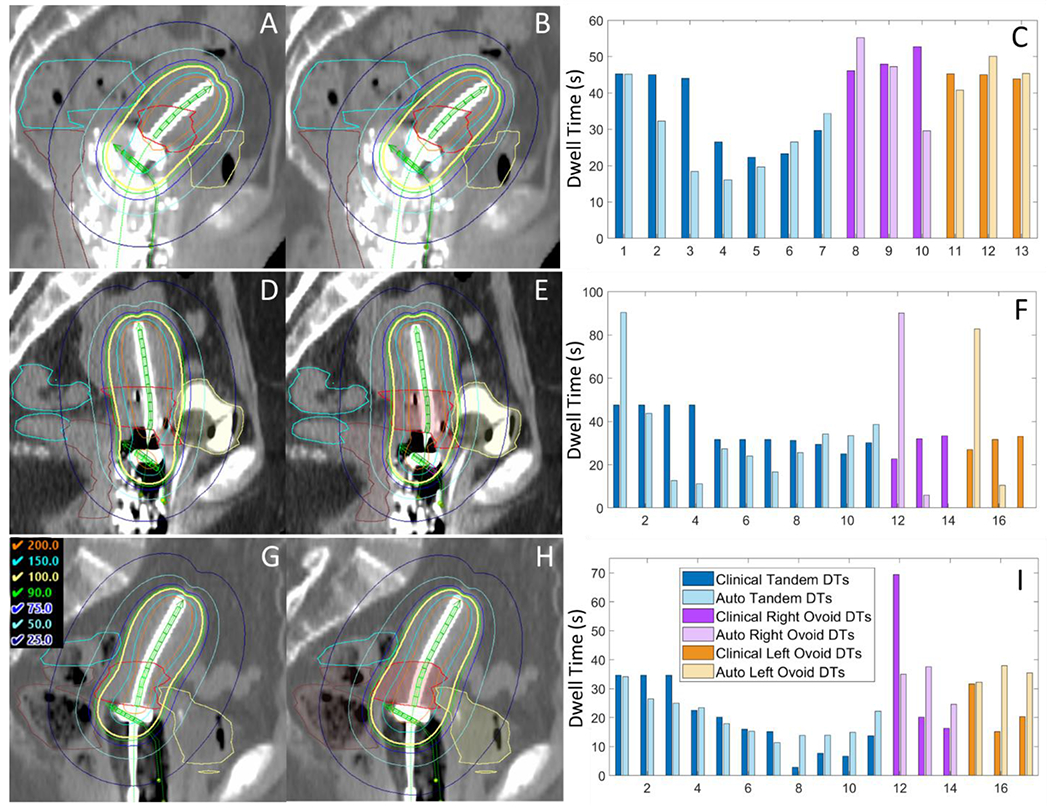
Figure 5.

Sagittal view of clinical plan dose (left) compared to automated plan dose (center), as well as a comparison of dwell times (right). (A-C) shows the best automated plan (subject 10), which was clinically acceptable (top); (D-F) shows the automated plan which featured the largest mean absolute difference in dwell times from the clinical plan (subject 4); and (G-I) shows the automated plan which featured the largest mean absolute difference in dose from the clinical plan (subject 2). Despite the largely varying dwell times, the middle plan (D-F) nearly met all clinical plan constraints, though the HRCTV coverage was slightly too low (D90 EQD2 = 83.5 Gy instead of >85 Gy). The bottom plan (G-I) featured more smooth dwell times than the clinical plan, yet did not adequately spare the OARs and in general was too hot.
