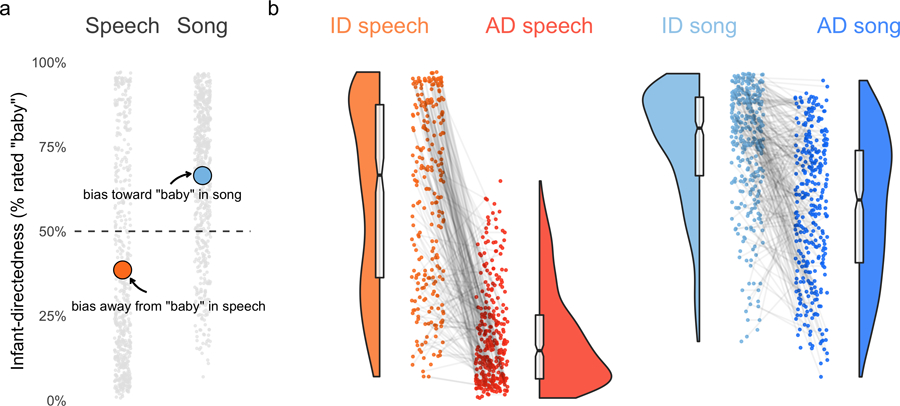
Extended Data Fig. 4 |. Response biases in the naive listener experiment.

a, Listeners showed reliable biases: regardless of whether a vocalization was infant- or adult-directed, the listeners gave speech recordings substantially fewer “baby” responses than expected by chance, and gave song recordings substantially more “baby” responses. The grey points represent average ratings for each of the recordings in the corpus that were used in the experiment (after exclusions, n = 1,138 recordings from the corpus of 1,615), split by speech and song; the orange and blue points indicate the means of each vocalization type; and the horizontal dashed line represents hypothetical chance level of 50%. b, Despite the response biases, within speech and song, the raw data nevertheless showed clear differences between infant-directed and adult-directed vocalizations, that is, by comparing infant-directedness scores within the same voice, across infant-directed and adult-directed vocalizations (visible here in the steep negative slopes of the grey lines). The main text results report only d’ statistics for these data, for simplicity, but the main effects are nonetheless visible here in the raw data. The points indicate average ratings for each recording; the grey lines connecting the points indicate the pairs of vocalizations produced by the same voice; the half-violins are kernel density estimations; the boxplots represent the medians, interquartile ranges and 95% confidence intervals (indicated by the notches); and the horizontal dashed lines indicate the response bias levels (from a).
