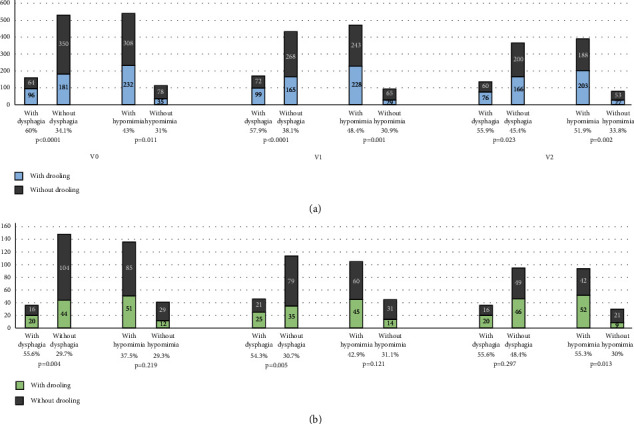
Figure 2.

(a) Number of patients reporting drooling at V0, V1, and V2 when they were divided in patients with vs. without dysphagia and with vs. without hypomimia (the whole cohort). A comparison between the percentage is shown for each analysis. (b) Number of patients from the PD ≤ 2 y group reporting drooling at V0, V1, and V2 when they were divided in patients with vs. without dysphagia and with vs. without hypomimia. A comparison between the percentage is shown for each analysis. PD: Parkinson's disease. PD ≤ 2 y group: patients with ≤2 years since symptom onset.
