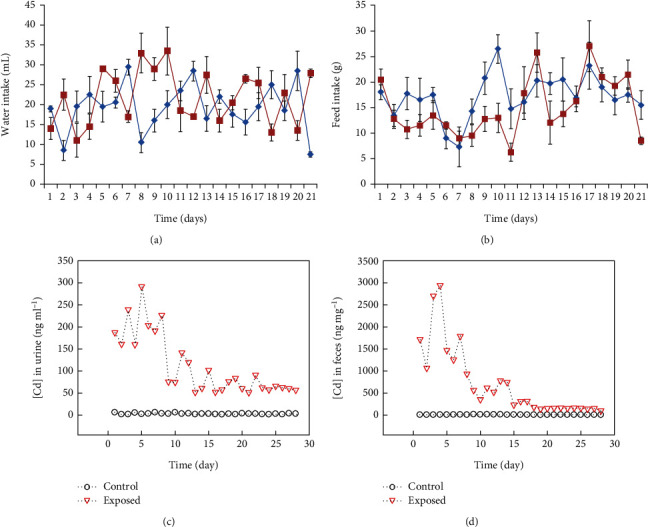
Figure 2.

Metabolic response of the Wistar rats (a) depicts water intake and (b) depicts food intake, with block lines representing the control and red line treated groups, respectively, graph showing the concentration of Cd in (c) urine and (d) feces in the control and exposed groups of rats.
