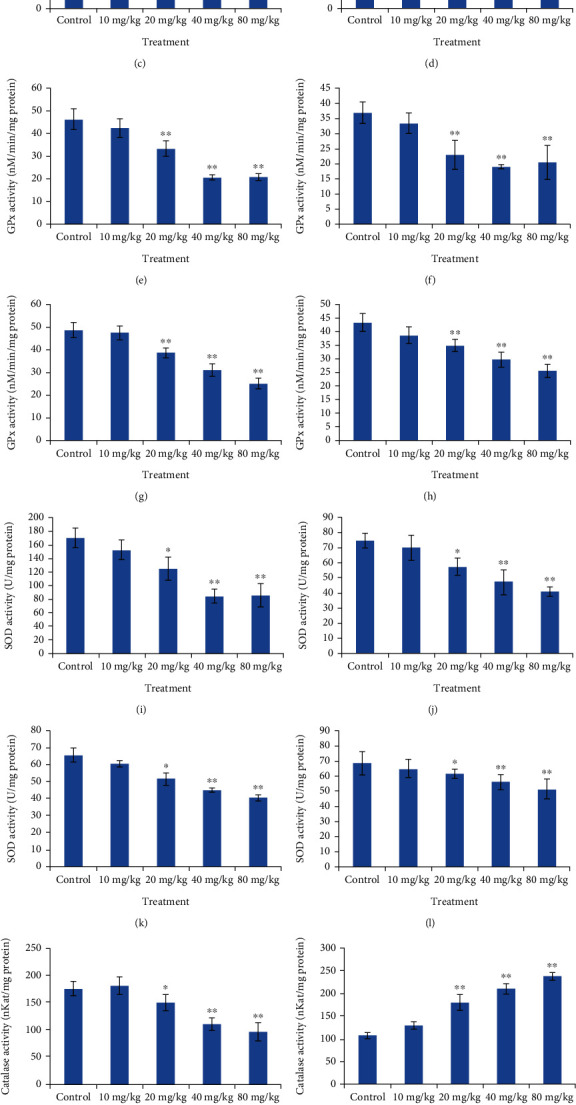
Figure 8.

Graph depicting comparison of antioxidative enzyme (the liver, kidney, and brain, respectively) in the control and CdSe QDs-treated Wistar rats. Lipid peroxidise activity in the (a) liver, (b) kidney, (c) brain, and (d) spleen. GPx activity in the (e) liver, (f) kidney, (g) brain, and (h) spleen. SOD activity in the (i) liver, (j) kidney, (k) brain, and (l) spleen. Catalase activity in the (m) liver, (n) kidney, (o) brain, and (p) spleen.
